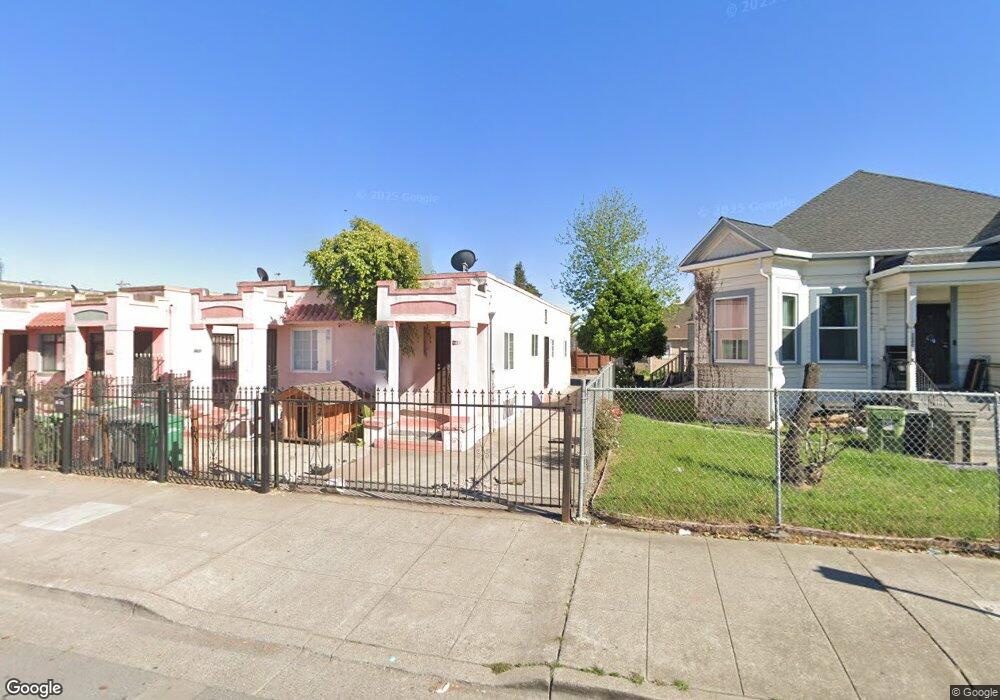
1210 98th Ave Oakland, CA 94603
North Stonehurst NeighborhoodEstimated Value: $419,000 - $646,000
2
Beds
2
Baths
1,380
Sq Ft
$390/Sq Ft
Est. Value
About This Home
This home is located at 1210 98th Ave, Oakland, CA 94603 and is currently estimated at $537,722, approximately $389 per square foot. 1210 98th Ave is a home located in Alameda County with nearby schools including Fred T. Korematsu Discovery Academy, Esperanza Elementary School, and Elmhurst United Middle School.
Ownership History
Date
Name
Owned For
Owner Type
Purchase Details
Closed on
Jun 16, 2015
Sold by
Rodriguez Fernando and Ortega Maria
Bought by
Ortega Maria and Rodriguez Cynthia Patricia
Current Estimated Value
Purchase Details
Closed on
Oct 29, 1996
Sold by
Otterstetter Harold L
Bought by
Rodriguez Fernando and Rodriguez Maria
Home Financials for this Owner
Home Financials are based on the most recent Mortgage that was taken out on this home.
Original Mortgage
$52,000
Outstanding Balance
$5,220
Interest Rate
8.3%
Mortgage Type
Seller Take Back
Estimated Equity
$532,502
Create a Home Valuation Report for This Property
The Home Valuation Report is an in-depth analysis detailing your home's value as well as a comparison with similar homes in the area
Home Values in the Area
Average Home Value in this Area
Purchase History
| Date | Buyer | Sale Price | Title Company |
|---|---|---|---|
| Ortega Maria | -- | None Available | |
| Rodriguez Fernando | $57,000 | Northwestern Title Co |
Source: Public Records
Mortgage History
| Date | Status | Borrower | Loan Amount |
|---|---|---|---|
| Open | Rodriguez Fernando | $52,000 |
Source: Public Records
Tax History Compared to Growth
Tax History
| Year | Tax Paid | Tax Assessment Tax Assessment Total Assessment is a certain percentage of the fair market value that is determined by local assessors to be the total taxable value of land and additions on the property. | Land | Improvement |
|---|---|---|---|---|
| 2025 | $3,502 | $92,828 | $27,848 | $64,980 |
| 2024 | $3,502 | $91,008 | $27,302 | $63,706 |
| 2023 | $3,510 | $89,224 | $26,767 | $62,457 |
| 2022 | $3,272 | $87,475 | $26,242 | $61,233 |
| 2021 | $2,902 | $85,760 | $25,728 | $60,032 |
| 2020 | $2,866 | $84,881 | $25,464 | $59,417 |
| 2019 | $2,615 | $83,217 | $24,965 | $58,252 |
| 2018 | $2,564 | $81,586 | $24,476 | $57,110 |
| 2017 | $4,480 | $233,578 | $70,073 | $163,505 |
| 2016 | $4,275 | $229,000 | $68,700 | $160,300 |
| 2015 | $2,129 | $77,241 | $23,172 | $54,069 |
| 2014 | $2,120 | $75,728 | $22,718 | $53,010 |
Source: Public Records
Map
Nearby Homes