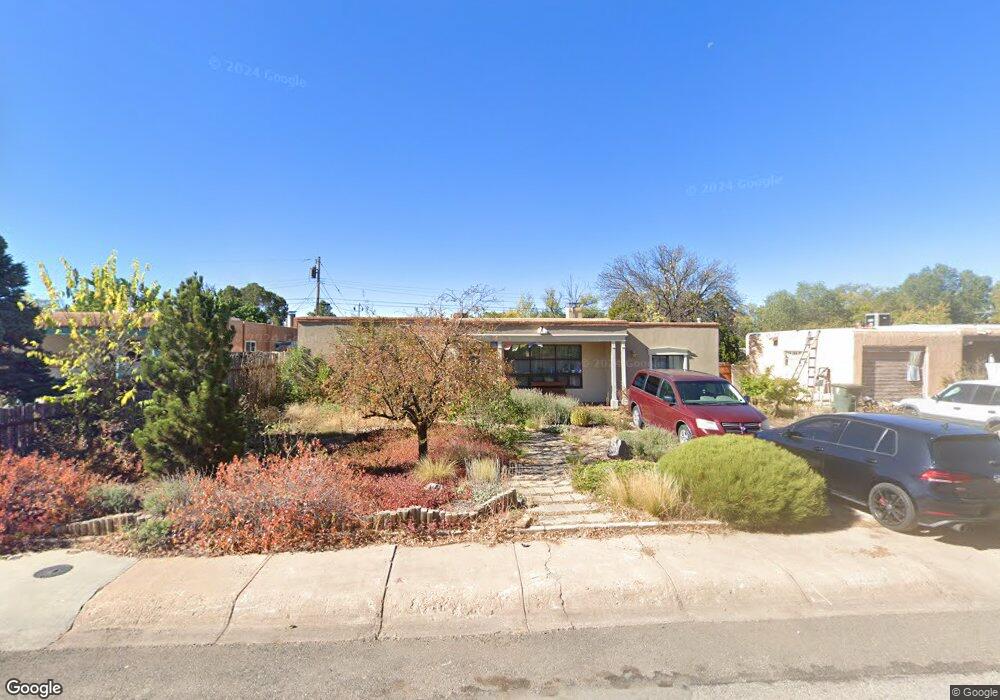
1210 Apache Ave Santa Fe, NM 87505
Casa Alegre NeighborhoodEstimated Value: $513,000 - $634,511
3
Beds
2
Baths
1,464
Sq Ft
$400/Sq Ft
Est. Value
About This Home
This home is located at 1210 Apache Ave, Santa Fe, NM 87505 and is currently estimated at $585,628, approximately $400 per square foot. 1210 Apache Ave is a home located in Santa Fe County with nearby schools including Salazar Elementary School, Milagro Middle School, and Santa Fe High School.
Ownership History
Date
Name
Owned For
Owner Type
Purchase Details
Closed on
Aug 22, 2014
Sold by
Montgomery Doug
Bought by
Elias Sharon J
Current Estimated Value
Home Financials for this Owner
Home Financials are based on the most recent Mortgage that was taken out on this home.
Original Mortgage
$220,000
Outstanding Balance
$168,250
Interest Rate
4.19%
Mortgage Type
New Conventional
Estimated Equity
$417,378
Purchase Details
Closed on
Mar 30, 2007
Sold by
Showacre Sylvia M
Bought by
Topple Chester C and Topple Trasie A
Home Financials for this Owner
Home Financials are based on the most recent Mortgage that was taken out on this home.
Original Mortgage
$250,000
Interest Rate
5.87%
Mortgage Type
Purchase Money Mortgage
Purchase Details
Closed on
Jul 27, 2006
Sold by
Stem Grady L and Showacre Sylvia M
Bought by
Showacre Sylvia M
Purchase Details
Closed on
Dec 10, 2001
Sold by
Karl Paul F and Karl Louise G
Bought by
Stem Grady
Create a Home Valuation Report for This Property
The Home Valuation Report is an in-depth analysis detailing your home's value as well as a comparison with similar homes in the area
Home Values in the Area
Average Home Value in this Area
Purchase History
| Date | Buyer | Sale Price | Title Company |
|---|---|---|---|
| Elias Sharon J | -- | None Available | |
| Topple Chester C | -- | Stsf | |
| Showacre Sylvia M | -- | None Available | |
| Stem Grady | -- | -- |
Source: Public Records
Mortgage History
| Date | Status | Borrower | Loan Amount |
|---|---|---|---|
| Open | Elias Sharon J | $220,000 | |
| Previous Owner | Topple Chester C | $250,000 |
Source: Public Records
Tax History Compared to Growth
Tax History
| Year | Tax Paid | Tax Assessment Tax Assessment Total Assessment is a certain percentage of the fair market value that is determined by local assessors to be the total taxable value of land and additions on the property. | Land | Improvement |
|---|---|---|---|---|
| 2024 | $4,168 | $546,973 | $95,000 | $451,973 |
| 2023 | $1,857 | $236,563 | $85,000 | $151,563 |
| 2022 | $1,816 | $229,673 | $85,000 | $144,673 |
| 2021 | $1,788 | $74,328 | $28,333 | $45,995 |
| 2020 | $1,734 | $72,163 | $28,333 | $43,830 |
| 2019 | $1,710 | $70,062 | $28,333 | $41,729 |
| 2018 | $1,672 | $68,021 | $28,333 | $39,688 |
| 2017 | $1,630 | $66,040 | $28,333 | $37,707 |
| 2016 | $1,537 | $64,117 | $28,333 | $35,784 |
| 2015 | $1,501 | $62,249 | $28,333 | $33,916 |
| 2014 | $1,365 | $60,376 | $28,305 | $32,071 |
Source: Public Records
Map
Nearby Homes
- 2043 Hopi Rd
- 1222 Vitalia St
- 965 Osage Ave
- 944 Camino Oraibi
- 2441 Calle Linda
- 1268 Maez Rd
- 1907 Chamisa St
- 1820 Kiva Rd
- 500 Camino Solano
- 506 Barela Ln
- 1304 Montoya Place
- 1141 Harrison Rd
- 2804 Isaiah Ln
- 1113 Paseo Corazon Unit 203
- 960 Acequia de Las Joyas
- 947 & 949 Acequia de Las Joyas
- 1170 Harrison Rd
- 1176 Harrison Rd
- 1912 Quapaw St
- 933 Nicole Place
- 1212 Apache Ave
- 1208 Apache Ave
- 1209 Vitalia St
- 1214 Apache Ave
- 1207 Vitalia St
- 1206 Apache Ave
- 2049 Kiva Rd
- 1211 Vitalia St
- 2055 Kiva Rd
- 1205 Vitalia St
- 1213 Vitalia St
- 1207 Apache Ave
- 1216 Apache Ave
- 1204 Apache Ave
- 1203 Vitalia St
- 2043 Kiva Rd
- 2050 Kiva Rd
- 1215 Vitalia St
- 2044 Otowi Rd
- 1218 Apache Ave