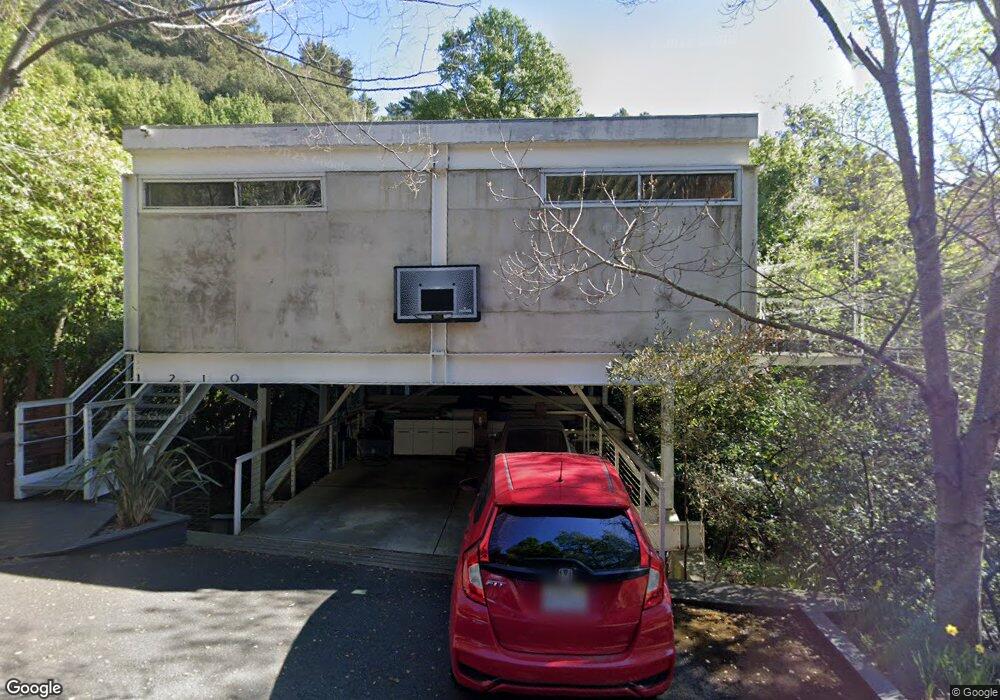
1210 Grand View Dr Berkeley, CA 94705
Claremont Hills NeighborhoodEstimated Value: $867,000 - $1,424,000
3
Beds
2
Baths
2,016
Sq Ft
$510/Sq Ft
Est. Value
About This Home
This home is located at 1210 Grand View Dr, Berkeley, CA 94705 and is currently estimated at $1,027,808, approximately $509 per square foot. 1210 Grand View Dr is a home with nearby schools including Chabot Elementary School, Thornhill Elementary School, and Claremont Middle School.
Ownership History
Date
Name
Owned For
Owner Type
Purchase Details
Closed on
Feb 2, 2009
Sold by
Collom Thomas L and Collom Erin M
Bought by
Collom Thomas L and Collom Erin M
Current Estimated Value
Purchase Details
Closed on
Aug 5, 1996
Sold by
Mooser William A
Bought by
Collom Thomas L and Collom Erin M
Home Financials for this Owner
Home Financials are based on the most recent Mortgage that was taken out on this home.
Original Mortgage
$20,000
Outstanding Balance
$1,580
Interest Rate
8.2%
Mortgage Type
Seller Take Back
Estimated Equity
$1,026,228
Purchase Details
Closed on
Sep 10, 1991
Sold by
Mooser Maria Depedraza
Bought by
Mooser William A
Home Financials for this Owner
Home Financials are based on the most recent Mortgage that was taken out on this home.
Original Mortgage
$20,000
Interest Rate
9.21%
Create a Home Valuation Report for This Property
The Home Valuation Report is an in-depth analysis detailing your home's value as well as a comparison with similar homes in the area
Home Values in the Area
Average Home Value in this Area
Purchase History
| Date | Buyer | Sale Price | Title Company |
|---|---|---|---|
| Collom Thomas L | -- | None Available | |
| Collom Thomas L | $55,000 | Old Republic Title Company | |
| Mooser William A | -- | -- |
Source: Public Records
Mortgage History
| Date | Status | Borrower | Loan Amount |
|---|---|---|---|
| Open | Collom Thomas L | $20,000 | |
| Previous Owner | Mooser William A | $20,000 |
Source: Public Records
Tax History
| Year | Tax Paid | Tax Assessment Tax Assessment Total Assessment is a certain percentage of the fair market value that is determined by local assessors to be the total taxable value of land and additions on the property. | Land | Improvement |
|---|---|---|---|---|
| 2025 | $10,910 | $702,835 | $89,572 | $613,263 |
| 2024 | $10,910 | $689,058 | $87,816 | $601,242 |
| 2023 | $11,415 | $675,548 | $86,094 | $589,454 |
| 2022 | $11,212 | $662,306 | $84,406 | $577,900 |
| 2021 | $10,840 | $649,321 | $82,751 | $566,570 |
| 2020 | $10,715 | $642,665 | $81,903 | $560,762 |
| 2019 | $10,332 | $630,069 | $80,298 | $549,771 |
| 2018 | $10,116 | $617,719 | $78,724 | $538,995 |
| 2017 | $9,732 | $605,611 | $77,180 | $528,431 |
| 2016 | $9,430 | $593,740 | $75,667 | $518,073 |
| 2015 | $9,518 | $584,825 | $74,531 | $510,294 |
| 2014 | $9,272 | $573,373 | $73,071 | $500,302 |
Source: Public Records
Map
Nearby Homes
- 1102 Grand View Dr
- 29 Live Oak Rd
- 0 Dartmouth Dr
- 1426 Grand View Dr
- 7041 Devon Way
- 1215 Alvarado Rd
- 150 Vicente Rd
- 142 Gravatt Dr
- 1881 Grand View Dr
- 1375 Alvarado Rd
- 260 Alvarado Rd
- 1383 Alvarado Rd
- 0 Gypsy Ln
- 0 Buckingham Blvd Unit 41115384
- 7003 Buckingham Blvd
- 7723 Claremont Ave
- 6971 Bristol Dr
- 7084 Westmoorland Dr
- 0 Gravatt Dr Unit 41122154
- 2 Gravatt Dr
- 1138 Grand View Dr
- 1228 Grand View Dr
- 630 Gravatt Dr
- 1190 Grand View Dr
- 638 Gravatt Dr
- 620 Gravatt Dr
- 616 Gravatt Dr
- 606 Gravatt Dr
- 1240 Grand View Dr
- 1110 Grand View Dr
- 1225 Grandview Dr
- 1219 Grand View Dr
- 0 View Dr Unit 40468391
- 1168 Besito Ave
- 1260 Grand View Dr
- 1102 W Grandview Dr
- 600 Gravatt Dr
- 1160 Besito Ave
- 1269 Grand View Dr
- 1150 Besito Ave
Your Personal Tour Guide
Ask me questions while you tour the home.