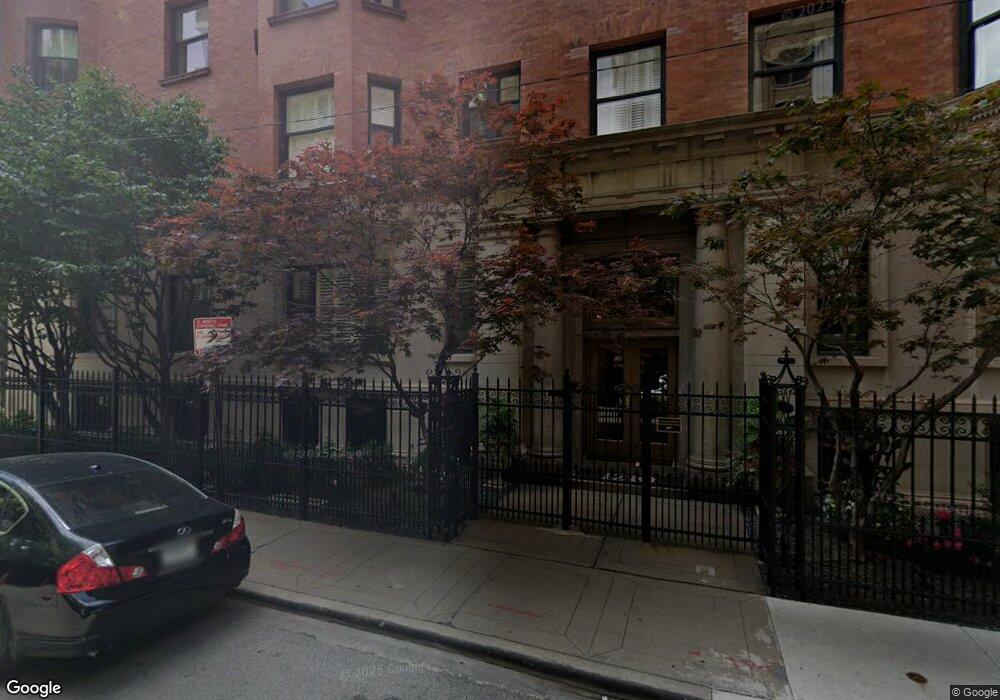
1210 N Astor St Unit 3B Chicago, IL 60610
Gold Coast NeighborhoodEstimated Value: $730,000 - $1,054,000
3
Beds
2
Baths
2,300
Sq Ft
$382/Sq Ft
Est. Value
About This Home
This home is located at 1210 N Astor St Unit 3B, Chicago, IL 60610 and is currently estimated at $877,481, approximately $381 per square foot. 1210 N Astor St Unit 3B is a home located in Cook County with nearby schools including Ogden Elementary School, Lincoln Park High School, and The Latin School Of Chicago.
Ownership History
Date
Name
Owned For
Owner Type
Purchase Details
Closed on
Dec 14, 2017
Sold by
Olevsky Maxim and Karmanova Margarita
Bought by
Olevsky Maxim
Current Estimated Value
Home Financials for this Owner
Home Financials are based on the most recent Mortgage that was taken out on this home.
Original Mortgage
$140,000
Outstanding Balance
$117,284
Interest Rate
3.75%
Mortgage Type
Adjustable Rate Mortgage/ARM
Estimated Equity
$760,197
Purchase Details
Closed on
Oct 23, 1998
Sold by
Moore Hugh L
Bought by
Olevsky Maxim and Karmanova Margarita
Home Financials for this Owner
Home Financials are based on the most recent Mortgage that was taken out on this home.
Original Mortgage
$360,000
Outstanding Balance
$77,595
Interest Rate
6.72%
Estimated Equity
$799,886
Create a Home Valuation Report for This Property
The Home Valuation Report is an in-depth analysis detailing your home's value as well as a comparison with similar homes in the area
Home Values in the Area
Average Home Value in this Area
Purchase History
| Date | Buyer | Sale Price | Title Company |
|---|---|---|---|
| Olevsky Maxim | -- | Mortgage Connect Lp | |
| Olevsky Maxim | $450,000 | -- |
Source: Public Records
Mortgage History
| Date | Status | Borrower | Loan Amount |
|---|---|---|---|
| Open | Olevsky Maxim | $140,000 | |
| Open | Olevsky Maxim | $360,000 |
Source: Public Records
Tax History Compared to Growth
Tax History
| Year | Tax Paid | Tax Assessment Tax Assessment Total Assessment is a certain percentage of the fair market value that is determined by local assessors to be the total taxable value of land and additions on the property. | Land | Improvement |
|---|---|---|---|---|
| 2024 | $17,176 | $105,331 | $11,155 | $94,176 |
| 2023 | $16,722 | $84,721 | $8,982 | $75,739 |
| 2022 | $16,722 | $84,721 | $8,982 | $75,739 |
| 2021 | $17,629 | $90,999 | $8,981 | $82,018 |
| 2020 | $14,010 | $65,994 | $6,287 | $59,707 |
| 2019 | $13,699 | $71,614 | $6,287 | $65,327 |
| 2018 | $13,468 | $71,614 | $6,287 | $65,327 |
| 2017 | $12,291 | $60,470 | $5,029 | $55,441 |
| 2016 | $11,611 | $60,470 | $5,029 | $55,441 |
| 2015 | $14,022 | $79,146 | $5,029 | $74,117 |
| 2014 | $13,874 | $77,347 | $4,041 | $73,306 |
| 2013 | $13,589 | $77,347 | $4,041 | $73,306 |
Source: Public Records
Map
Nearby Homes
- 1210 N Astor St Unit 1A
- 53 E Division St
- 60 E Scott St Unit 403
- 1212 N Lake Shore Dr Unit 34BN
- 1212 N Lake Shore Dr Unit 12CN
- 1212 N Lake Shore Dr Unit 11CS
- 1212 N Lake Shore Dr Unit 28CS
- 1212 N Lake Shore Dr Unit 16BS
- 1240 N Lake Shore Dr Unit 14A
- 1240 N Lake Shore Dr Unit 25A
- 65 E Goethe St Unit 4N
- 30 E Elm St Unit 14E
- 1242 N Lake Shore Dr Unit 4N
- 1242 N Lake Shore Dr Unit 22
- 1242 N Lake Shore Dr Unit 25
- 1150 N Lake Shore Dr Unit 13D
- 1150 N Lake Shore Dr Unit 19A
- 1150 N Lake Shore Dr Unit 13A
- 1150 N Lake Shore Dr Unit 20E
- 1150 N Lake Shore Dr Unit 7E
- 1210 N Astor St Unit A1
- 1210 N Astor St Unit 6A
- 1210 N Astor St Unit 4A
- 1210 N Astor St Unit 5B
- 1210 N Astor St Unit 3A
- 1200 N Astor St Unit 1-A
- 1210 N Astor St Unit 6B
- 1200 N Astor St Unit 4-B
- 1210 N Astor St Unit 2A
- 1200 N Astor St Unit 7-B
- 1210 N Astor St Unit 1B
- 1200 N Astor St Unit 7-A
- 1210 N Astor St Unit 5A
- 1210 N Astor St Unit 4B
- 1210 N Astor St Unit 7A
- 30 E Division St Unit 4D
- 30 E Division St Unit 10C
- 30 E Division St Unit 7A
- 30 E Division St Unit 15C
- 30 E Division St Unit 14C