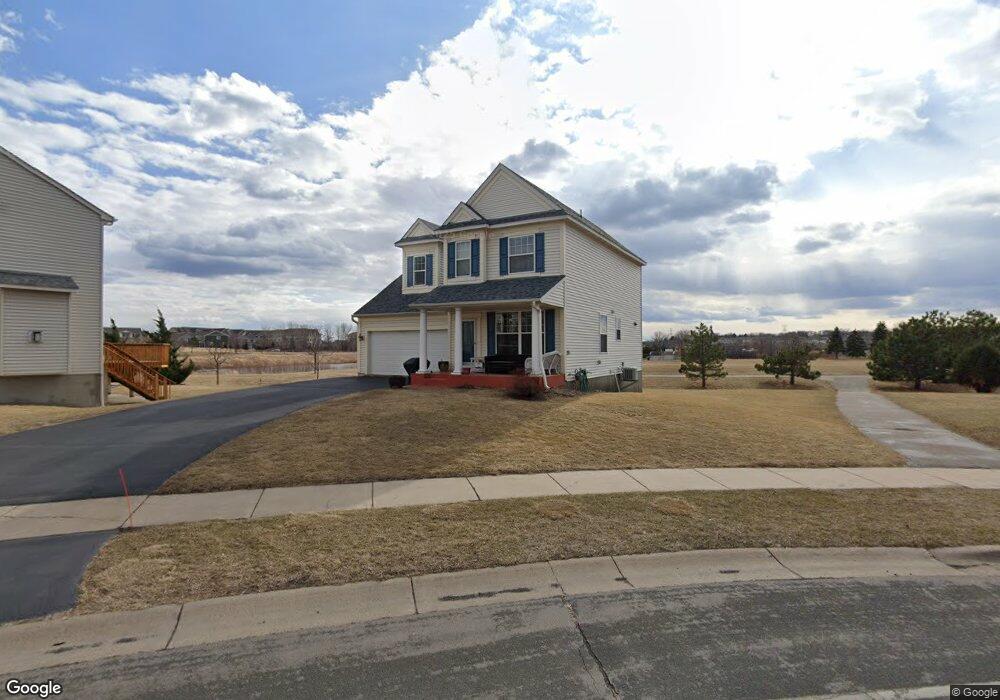
12101 85th Ave N Maple Grove, MN 55369
Estimated Value: $475,000 - $545,000
3
Beds
3
Baths
1,961
Sq Ft
$259/Sq Ft
Est. Value
About This Home
This home is located at 12101 85th Ave N, Maple Grove, MN 55369 and is currently estimated at $508,374, approximately $259 per square foot. 12101 85th Ave N is a home located in Hennepin County with nearby schools including Rice Lake Elementary School, Maple Grove Middle School, and Maple Grove Senior High School.
Ownership History
Date
Name
Owned For
Owner Type
Purchase Details
Closed on
Aug 14, 2020
Sold by
Frantz Bryan D and Frantz Jennifer
Bought by
Frantz Bryan D and Frantz Jennifer M
Current Estimated Value
Home Financials for this Owner
Home Financials are based on the most recent Mortgage that was taken out on this home.
Original Mortgage
$260,000
Outstanding Balance
$230,638
Interest Rate
3%
Mortgage Type
New Conventional
Estimated Equity
$277,736
Purchase Details
Closed on
Apr 20, 2010
Sold by
Bahel Sanjay and Bahel Anuradha
Bought by
Frantz Bryan D and Frantz Jennifer
Purchase Details
Closed on
Nov 24, 2003
Sold by
The Rottlund Company Inc
Bought by
Bahel Sanjay and Bahel Anuradha
Purchase Details
Closed on
Oct 22, 2001
Sold by
Tradition Development Llc
Bought by
The Rottlund Company Inc
Create a Home Valuation Report for This Property
The Home Valuation Report is an in-depth analysis detailing your home's value as well as a comparison with similar homes in the area
Home Values in the Area
Average Home Value in this Area
Purchase History
| Date | Buyer | Sale Price | Title Company |
|---|---|---|---|
| Frantz Bryan D | -- | The Title Group Inc | |
| Frantz Bryan D | $286,000 | -- | |
| Bahel Sanjay | $323,365 | -- | |
| The Rottlund Company Inc | $446,725 | -- |
Source: Public Records
Mortgage History
| Date | Status | Borrower | Loan Amount |
|---|---|---|---|
| Open | Frantz Bryan D | $260,000 |
Source: Public Records
Tax History Compared to Growth
Tax History
| Year | Tax Paid | Tax Assessment Tax Assessment Total Assessment is a certain percentage of the fair market value that is determined by local assessors to be the total taxable value of land and additions on the property. | Land | Improvement |
|---|---|---|---|---|
| 2024 | $5,467 | $452,800 | $119,200 | $333,600 |
| 2023 | $5,444 | $463,700 | $136,600 | $327,100 |
| 2022 | $4,485 | $449,500 | $115,200 | $334,300 |
| 2021 | $4,264 | $371,900 | $93,400 | $278,500 |
| 2020 | $4,136 | $348,100 | $78,700 | $269,400 |
| 2019 | $4,421 | $324,700 | $69,200 | $255,500 |
| 2018 | $4,182 | $327,200 | $87,900 | $239,300 |
| 2017 | $4,312 | $302,800 | $84,000 | $218,800 |
| 2016 | $4,275 | $296,300 | $84,000 | $212,300 |
| 2015 | $4,135 | $280,200 | $75,000 | $205,200 |
| 2014 | -- | $260,700 | $77,900 | $182,800 |
Source: Public Records
Map
Nearby Homes
- 11879 85th Place N Unit 54
- 11858 84th Ave N
- 11712 84th Ave N Unit 309
- 8350 Jonquil Ln N
- 12598 84th Place N
- 10516 Harbor Ln N
- 8399 Norwood Ln N
- 8215 Deerwood Ln N
- 12225 82nd Ave N Unit 66
- 11601 82nd Ave N
- 8326 Oakview Ct N
- 8142 Oakview Ln N Unit 53
- 12509 88th Ave N
- 11540 81st Place N
- 11486 81st Place N
- 11462 81st Place N
- 8025 Larch Ln N
- 8361 Arrowwood Ln N
- 11760 88th Place N
- 8704 Cottonwood Ln N
- 8487 Jonquil Ln N
- 8475 Jonquil Ln N
- 12131 85th Ave N
- 12131 12131 85th-Avenue-n
- 8463 Jonquil Ln N
- 12143 85th Ave N
- 8451 Jonquil Ln N
- 12155 85th Ave N
- 8474 Jonquil Ln N
- 8486 Jonquil Ln N
- 8498 Jonquil Ln N
- 8439 Jonquil Ln N
- 12140 85th Ave N
- 8462 Jonquil Ln N
- 12128 85th Ave N
- 12128 12128 85th-Avenue-n
- 12167 85th Ave N
- 12152 85th Ave N
- 8427 Jonquil Ln N
- 12116 85th Ave N