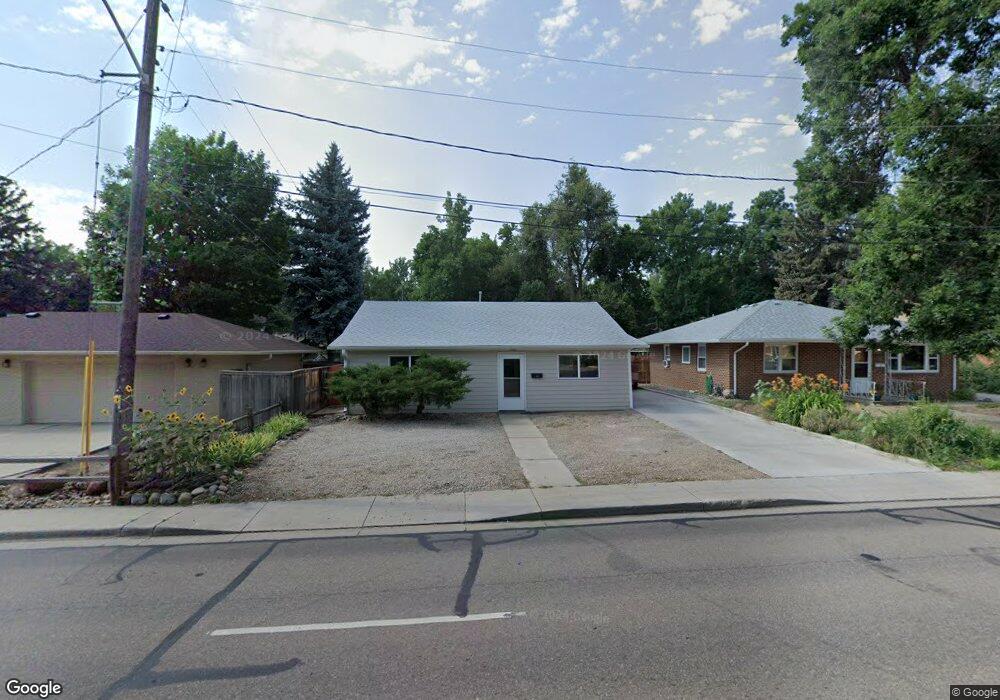
1211 9th Ave Longmont, CO 80501
Sunset NeighborhoodEstimated Value: $388,000 - $480,000
2
Beds
1
Bath
1,020
Sq Ft
$419/Sq Ft
Est. Value
About This Home
This home is located at 1211 9th Ave, Longmont, CO 80501 and is currently estimated at $427,471, approximately $419 per square foot. 1211 9th Ave is a home located in Boulder County with nearby schools including Central Elementary School, Westview Middle School, and Longmont High School.
Ownership History
Date
Name
Owned For
Owner Type
Purchase Details
Closed on
Mar 5, 2007
Sold by
Aurora Loan Services Llc
Bought by
Sims Matthew A and Sims Diana L
Current Estimated Value
Home Financials for this Owner
Home Financials are based on the most recent Mortgage that was taken out on this home.
Original Mortgage
$118,587
Outstanding Balance
$71,582
Interest Rate
6.21%
Mortgage Type
FHA
Estimated Equity
$355,889
Purchase Details
Closed on
Oct 19, 2006
Sold by
Vandoan Henry and Doan Kim
Bought by
Aurora Loan Services Llc
Purchase Details
Closed on
Jun 19, 2003
Sold by
Vandoan Henry and Doan Kim
Bought by
Vandoan Henry
Home Financials for this Owner
Home Financials are based on the most recent Mortgage that was taken out on this home.
Original Mortgage
$137,000
Interest Rate
5.25%
Mortgage Type
Purchase Money Mortgage
Purchase Details
Closed on
May 15, 2001
Sold by
Vandoan Henry and Doan Kim
Bought by
Vandoan Henry
Purchase Details
Closed on
Mar 12, 1998
Sold by
Vandoan Huy
Bought by
Vandoan Henry
Purchase Details
Closed on
Jan 20, 1987
Bought by
Sims Matthew A and Sims Diana L
Create a Home Valuation Report for This Property
The Home Valuation Report is an in-depth analysis detailing your home's value as well as a comparison with similar homes in the area
Home Values in the Area
Average Home Value in this Area
Purchase History
| Date | Buyer | Sale Price | Title Company |
|---|---|---|---|
| Sims Matthew A | $120,000 | Chicago Title Co | |
| Aurora Loan Services Llc | -- | None Available | |
| Vandoan Henry | -- | -- | |
| Vandoan Henry | -- | -- | |
| Vandoan Henry | -- | -- | |
| Sims Matthew A | -- | -- |
Source: Public Records
Mortgage History
| Date | Status | Borrower | Loan Amount |
|---|---|---|---|
| Open | Sims Matthew A | $118,587 | |
| Previous Owner | Vandoan Henry | $137,000 |
Source: Public Records
Tax History Compared to Growth
Tax History
| Year | Tax Paid | Tax Assessment Tax Assessment Total Assessment is a certain percentage of the fair market value that is determined by local assessors to be the total taxable value of land and additions on the property. | Land | Improvement |
|---|---|---|---|---|
| 2025 | $2,116 | $26,863 | $8,844 | $18,019 |
| 2024 | $2,116 | $26,863 | $8,844 | $18,019 |
| 2023 | $2,087 | $22,117 | $9,963 | $15,839 |
| 2022 | $1,944 | $19,641 | $7,353 | $12,288 |
| 2021 | $1,969 | $20,206 | $7,565 | $12,641 |
| 2020 | $2,167 | $22,309 | $6,793 | $15,516 |
| 2019 | $2,133 | $22,309 | $6,793 | $15,516 |
| 2018 | $1,661 | $17,489 | $7,416 | $10,073 |
| 2017 | $1,639 | $19,335 | $8,199 | $11,136 |
| 2016 | $1,405 | $14,702 | $7,960 | $6,742 |
| 2015 | $1,339 | $12,584 | $3,900 | $8,684 |
| 2014 | $1,175 | $12,584 | $3,900 | $8,684 |
Source: Public Records
Map
Nearby Homes
- 1214 9th Ave
- 931 Venice St
- 818 Lincoln St
- 814 Gay St
- 1012 Pratt St Unit 1012
- 1136 Venice St
- 1019 Alta St Unit 1019
- 813 Vivian St
- 1209 Gay St
- 1217 Lincoln St
- 623 Pratt St
- 402 Sherman St
- 1247 Lincoln St
- 1202 Vivian St
- 1224 Judson St
- 1314 Venice St
- 1208 Juniper St
- 895 Faith Ct
- 1344 Aspen Place
- 820 Kimbark St Unit D