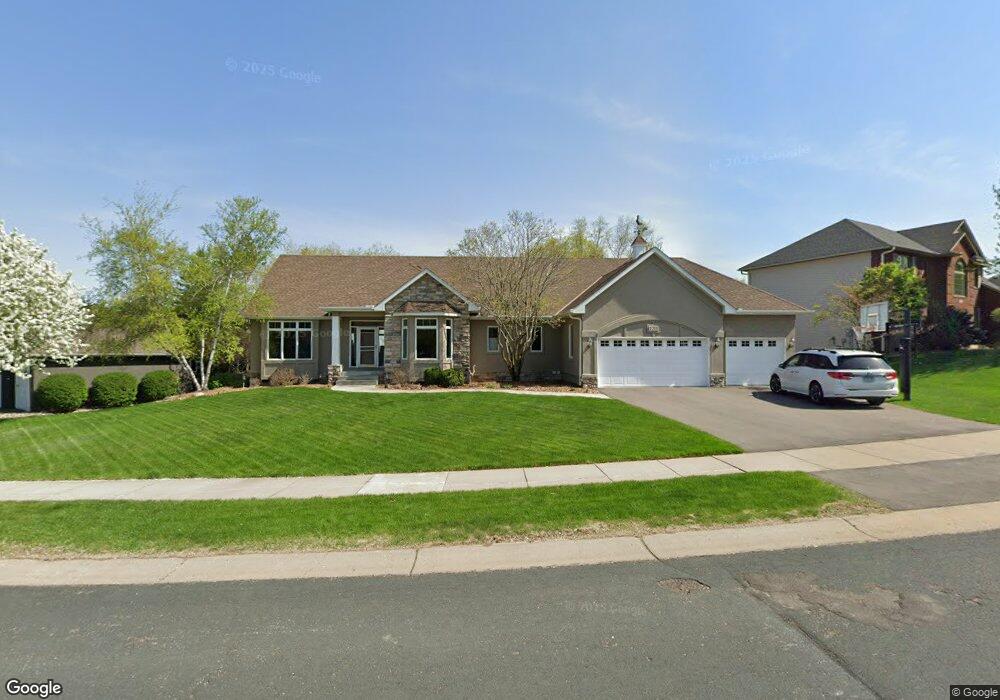
1211 Adrian Dr Chaska, MN 55318
Estimated Value: $829,000 - $1,033,000
4
Beds
4
Baths
2,479
Sq Ft
$378/Sq Ft
Est. Value
About This Home
This home is located at 1211 Adrian Dr, Chaska, MN 55318 and is currently estimated at $936,675, approximately $377 per square foot. 1211 Adrian Dr is a home located in Carver County with nearby schools including Jonathan Elementary School, Chaska Middle School East, and Chaska High School.
Ownership History
Date
Name
Owned For
Owner Type
Purchase Details
Closed on
Jan 22, 2018
Sold by
Johnson James K and Johnson Coral J
Bought by
Johnson Coral J and Johnson James K
Current Estimated Value
Purchase Details
Closed on
Jul 26, 2013
Sold by
Monteith Brian William and Monteith Jennifer Sue
Bought by
Johnson James K and Johnson Coral J
Home Financials for this Owner
Home Financials are based on the most recent Mortgage that was taken out on this home.
Original Mortgage
$225,000
Outstanding Balance
$55,742
Interest Rate
4.29%
Mortgage Type
New Conventional
Estimated Equity
$880,933
Purchase Details
Closed on
Mar 2, 2001
Sold by
Kerber Homes Inc
Bought by
Monteith Brian William and Monteith Jennifer Sue
Purchase Details
Closed on
Aug 1, 2000
Sold by
Chaska Investment Ltd Partnership
Bought by
Kerber Homes Inc
Create a Home Valuation Report for This Property
The Home Valuation Report is an in-depth analysis detailing your home's value as well as a comparison with similar homes in the area
Home Values in the Area
Average Home Value in this Area
Purchase History
| Date | Buyer | Sale Price | Title Company |
|---|---|---|---|
| Johnson Coral J | -- | None Available | |
| Johnson James K | $596,551 | Cornerstone Title | |
| Monteith Brian William | $566,171 | -- | |
| Kerber Homes Inc | $103,000 | -- |
Source: Public Records
Mortgage History
| Date | Status | Borrower | Loan Amount |
|---|---|---|---|
| Open | Johnson James K | $225,000 |
Source: Public Records
Tax History Compared to Growth
Tax History
| Year | Tax Paid | Tax Assessment Tax Assessment Total Assessment is a certain percentage of the fair market value that is determined by local assessors to be the total taxable value of land and additions on the property. | Land | Improvement |
|---|---|---|---|---|
| 2025 | $10,194 | $816,000 | $185,000 | $631,000 |
| 2024 | $9,784 | $789,200 | $185,000 | $604,200 |
| 2023 | $9,474 | $777,100 | $185,000 | $592,100 |
| 2022 | $8,698 | $785,800 | $166,300 | $619,500 |
| 2021 | $8,354 | $658,000 | $138,600 | $519,400 |
| 2020 | $8,244 | $646,500 | $138,600 | $507,900 |
| 2019 | $7,948 | $602,200 | $132,000 | $470,200 |
| 2018 | $36 | $602,200 | $132,000 | $470,200 |
| 2017 | $7,740 | $596,400 | $132,000 | $464,400 |
| 2016 | $7,892 | $561,500 | $0 | $0 |
| 2015 | $7,748 | $565,800 | $0 | $0 |
| 2014 | $7,748 | $531,600 | $0 | $0 |
Source: Public Records
Map
Nearby Homes
- XXX Bavaria Rd
- 1056 Rosemary Cir
- 661 Satori Way
- 1646 Isabella Pkwy
- 2814 Spy Glass Dr
- 441 Pleasant Ln
- 1772 Emerson Ct
- 349 Pleasant Ln
- 3225 Mcknight Rd
- 110102 Arboretum Way
- 110312 Center Green Cir
- 110309 Center Green Cir
- 114200 Hundertmark Rd Unit 209
- 110696 Village Rd Unit 219
- 3115 Clover Ridge Dr
- 110282 Village Rd
- 2908 Mark Twain Dr
- 6513 Timber Arch Dr
- 3859 Pascolo Bend
- 3838 Pascolo Bend
- 1215 Adrian Dr
- 1209 Adrian Dr
- 1212 Adrian Dr
- 1225 Adrian Dr
- 1214 Adrian Cir
- 1207 Adrian Dr
- 1210 Adrian Dr
- 1208 Adrian Dr
- 1226 Adrian Dr
- 1227 Adrian Dr
- 1205 Adrian Dr
- 1216 Adrian Cir
- 1206 Adrian Dr
- 1224 Adrian Cir
- 1228 Adrian Dr
- 1204 Adrian Dr
- 1229 Adrian Dr
- 1218 Adrian Cir
- 1222 Adrian Cir
- 1220 Adrian Cir