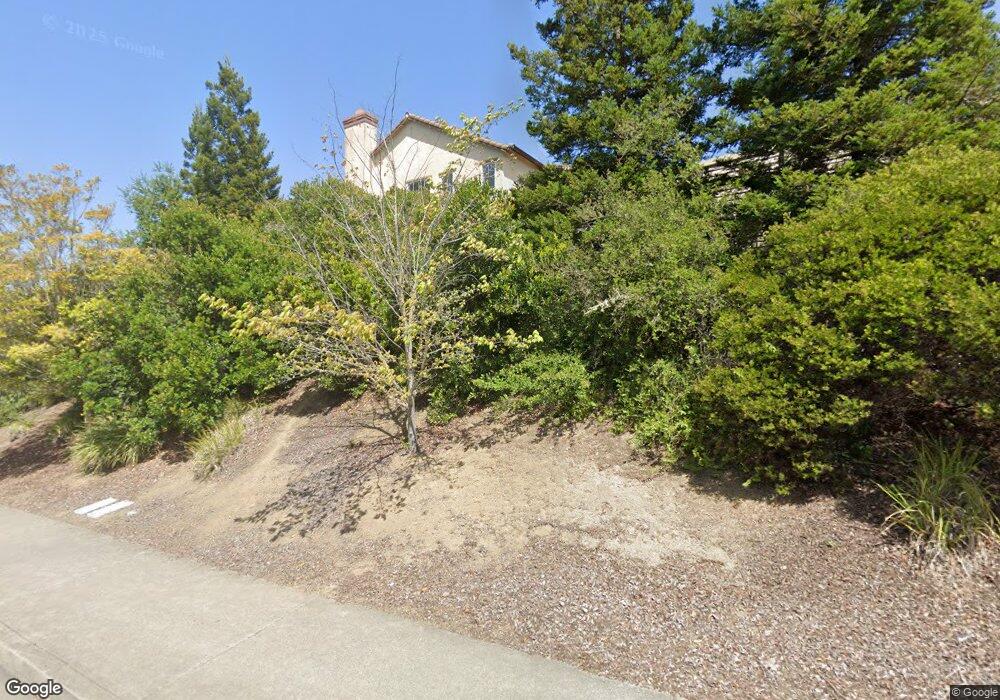
1211 Andrea Way Vallejo, CA 94591
Estimated Value: $631,919 - $712,000
4
Beds
3
Baths
2,020
Sq Ft
$333/Sq Ft
Est. Value
About This Home
This home is located at 1211 Andrea Way, Vallejo, CA 94591 and is currently estimated at $673,480, approximately $333 per square foot. 1211 Andrea Way is a home located in Solano County with nearby schools including Joseph H. Wardlaw Elementary School, Hogan Middle School, and Jesse M. Bethel High School.
Ownership History
Date
Name
Owned For
Owner Type
Purchase Details
Closed on
Oct 18, 2013
Sold by
Allen James E
Bought by
Rillera Olivia Sigua and Rillera Vincent Thomas
Current Estimated Value
Home Financials for this Owner
Home Financials are based on the most recent Mortgage that was taken out on this home.
Original Mortgage
$349,551
Outstanding Balance
$261,637
Interest Rate
4.4%
Mortgage Type
FHA
Estimated Equity
$411,843
Purchase Details
Closed on
Dec 13, 2011
Sold by
Village Solutions Foundation
Bought by
Allen James E
Purchase Details
Closed on
Sep 29, 2011
Sold by
Jpmorgan Chase Bank National Association
Bought by
Village Solutions Foundation
Purchase Details
Closed on
Jun 21, 2011
Sold by
Childress Zackery and Childress Christine
Bought by
Jpmorgan Chase Bank National Association
Purchase Details
Closed on
Oct 27, 2005
Sold by
Laetsch Harold and Laetsch Pelagia
Bought by
Childress Zackery and Childress Christine
Home Financials for this Owner
Home Financials are based on the most recent Mortgage that was taken out on this home.
Original Mortgage
$437,500
Interest Rate
5.9%
Mortgage Type
Purchase Money Mortgage
Purchase Details
Closed on
May 26, 2005
Sold by
Laetsch Harold and Laetsch Pelagia
Bought by
Laetsch Harold and Laetsch Pelagia
Home Financials for this Owner
Home Financials are based on the most recent Mortgage that was taken out on this home.
Original Mortgage
$187,500
Interest Rate
5.74%
Mortgage Type
Purchase Money Mortgage
Purchase Details
Closed on
Oct 26, 2004
Sold by
Laetsch Harold
Bought by
Laetsch Harold and Laetsch Pelagia
Home Financials for this Owner
Home Financials are based on the most recent Mortgage that was taken out on this home.
Original Mortgage
$400,000
Interest Rate
5.62%
Mortgage Type
New Conventional
Purchase Details
Closed on
Aug 26, 2003
Sold by
Laetsch Pelagia D
Bought by
Laetsch Harold
Home Financials for this Owner
Home Financials are based on the most recent Mortgage that was taken out on this home.
Original Mortgage
$335,999
Interest Rate
7.62%
Mortgage Type
Purchase Money Mortgage
Purchase Details
Closed on
Aug 8, 2003
Sold by
Richmond American Homes Of Ca Inc
Bought by
Laetsch Harold
Home Financials for this Owner
Home Financials are based on the most recent Mortgage that was taken out on this home.
Original Mortgage
$335,999
Interest Rate
7.62%
Mortgage Type
Purchase Money Mortgage
Create a Home Valuation Report for This Property
The Home Valuation Report is an in-depth analysis detailing your home's value as well as a comparison with similar homes in the area
Home Values in the Area
Average Home Value in this Area
Purchase History
| Date | Buyer | Sale Price | Title Company |
|---|---|---|---|
| Rillera Olivia Sigua | $356,000 | North American Title Company | |
| Allen James E | $235,000 | North American Title Company | |
| Village Solutions Foundation | $215,000 | None Available | |
| Jpmorgan Chase Bank National Association | $201,228 | Accommodation | |
| Childress Zackery | $625,000 | North American Title Co | |
| Laetsch Harold | -- | -- | |
| Laetsch Harold | -- | First American Title Co | |
| Laetsch Harold | -- | Chicago | |
| Laetsch Harold | $420,000 | Chicago |
Source: Public Records
Mortgage History
| Date | Status | Borrower | Loan Amount |
|---|---|---|---|
| Open | Rillera Olivia Sigua | $349,551 | |
| Previous Owner | Childress Zackery | $437,500 | |
| Previous Owner | Laetsch Harold | $187,500 | |
| Previous Owner | Laetsch Harold | $400,000 | |
| Previous Owner | Laetsch Harold | $335,999 | |
| Closed | Laetsch Harold | $84,000 | |
| Closed | Laetsch Harold | $50,000 |
Source: Public Records
Tax History Compared to Growth
Tax History
| Year | Tax Paid | Tax Assessment Tax Assessment Total Assessment is a certain percentage of the fair market value that is determined by local assessors to be the total taxable value of land and additions on the property. | Land | Improvement |
|---|---|---|---|---|
| 2025 | $6,103 | $436,393 | $116,448 | $319,945 |
| 2024 | $6,103 | $427,837 | $114,165 | $313,672 |
| 2023 | $6,556 | $419,449 | $111,927 | $307,522 |
| 2022 | $6,474 | $411,226 | $109,735 | $301,491 |
| 2021 | $6,353 | $403,164 | $107,584 | $295,580 |
| 2020 | $6,393 | $399,031 | $106,481 | $292,550 |
| 2019 | $6,242 | $391,208 | $104,394 | $286,814 |
| 2018 | $5,911 | $383,539 | $102,348 | $281,191 |
| 2017 | $5,702 | $376,020 | $100,342 | $275,678 |
| 2016 | $5,135 | $368,648 | $98,375 | $270,273 |
| 2015 | $5,080 | $363,112 | $96,898 | $266,214 |
| 2014 | $5,021 | $356,000 | $95,000 | $261,000 |
Source: Public Records
Map
Nearby Homes
- 1202 Andrea Way
- 1290 Rachel Way
- 715 Knights Cir
- 1025 Columbus Pkwy
- 1407 Eucalyptus Dr
- 1218 Locust Dr
- 1279 Eucalyptus Dr
- 134 Nashville Ln
- 154 Turnberry Way
- 425 Lexington Dr
- 237 Grapewood St
- 160 Muirwood Place
- 296 Cottonwood Dr
- 312 Cottonwood Dr
- 152 Masonic Dr
- 325 Cottonwood Dr
- 133 Patrick Ct
- 2500 Springs Rd Unit 126
- 2500 Springs Rd Unit 121
- 2500 Springs Rd Unit 226
- 1215 Andrea Way
- 1209 Andrea Way
- 1217 Andrea Way
- 1207 Andrea Way
- 1219 Andrea Way
- 1208 Andrea Way
- 1205 Andrea Way
- 1221 Andrea Way
- 1206 Andrea Way
- 1289 Rachel Way
- 1204 Andrea Way
- 1203 Andrea Way
- 189 Coventry Way
- 1223 Andrea Way
- 167 Coventry Way
- 1287 Rachel Way
- 100 Birkdale Ct
- 135 Coventry Way
- 1285 Rachel Way
- 1201 Andrea Way