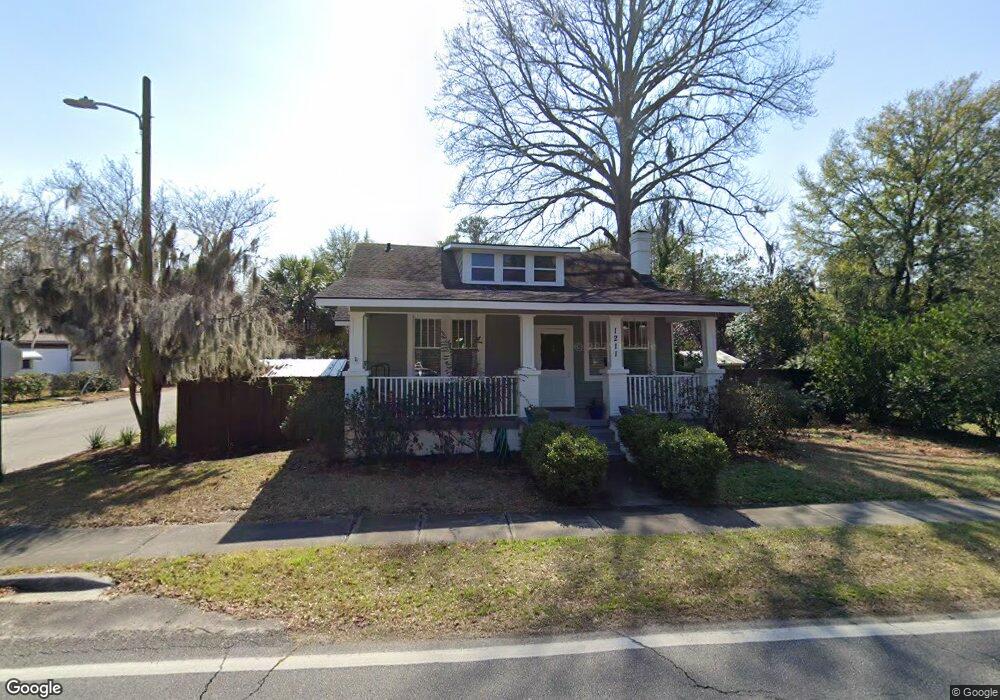
1211 Bonaventure Rd Savannah, GA 31404
Avondale NeighborhoodEstimated Value: $296,297 - $360,000
3
Beds
1
Bath
1,454
Sq Ft
$227/Sq Ft
Est. Value
About This Home
This home is located at 1211 Bonaventure Rd, Savannah, GA 31404 and is currently estimated at $330,574, approximately $227 per square foot. 1211 Bonaventure Rd is a home located in Chatham County with nearby schools including Shuman Elementary School, Hubert Middle School, and Johnson High School.
Ownership History
Date
Name
Owned For
Owner Type
Purchase Details
Closed on
Nov 5, 2009
Sold by
Tillman Clifford R
Bought by
Gabbert Allison M
Current Estimated Value
Home Financials for this Owner
Home Financials are based on the most recent Mortgage that was taken out on this home.
Original Mortgage
$159,556
Outstanding Balance
$103,810
Interest Rate
4.93%
Mortgage Type
FHA
Estimated Equity
$226,764
Purchase Details
Closed on
Oct 30, 2009
Sold by
Krebs Susan J
Bought by
Stivers David A and Newell Kathleen E
Home Financials for this Owner
Home Financials are based on the most recent Mortgage that was taken out on this home.
Original Mortgage
$159,556
Outstanding Balance
$103,810
Interest Rate
4.93%
Mortgage Type
FHA
Estimated Equity
$226,764
Purchase Details
Closed on
Dec 31, 2004
Sold by
Si Properties Llc
Bought by
Krebs Susan J
Home Financials for this Owner
Home Financials are based on the most recent Mortgage that was taken out on this home.
Original Mortgage
$80,500
Interest Rate
5.71%
Mortgage Type
New Conventional
Purchase Details
Closed on
Sep 7, 2004
Sold by
Lanier Marion T
Bought by
Si Properties Llc
Create a Home Valuation Report for This Property
The Home Valuation Report is an in-depth analysis detailing your home's value as well as a comparison with similar homes in the area
Home Values in the Area
Average Home Value in this Area
Purchase History
| Date | Buyer | Sale Price | Title Company |
|---|---|---|---|
| Gabbert Allison M | $220,000 | -- | |
| Stivers David A | $162,500 | -- | |
| Krebs Susan J | $80,500 | -- | |
| Krebs Susan J | $80,500 | -- | |
| Si Properties Llc | $57,500 | -- |
Source: Public Records
Mortgage History
| Date | Status | Borrower | Loan Amount |
|---|---|---|---|
| Open | Stivers David A | $159,556 | |
| Previous Owner | Krebs Susan J | $80,500 |
Source: Public Records
Tax History Compared to Growth
Tax History
| Year | Tax Paid | Tax Assessment Tax Assessment Total Assessment is a certain percentage of the fair market value that is determined by local assessors to be the total taxable value of land and additions on the property. | Land | Improvement |
|---|---|---|---|---|
| 2025 | $2,036 | $116,880 | $16,000 | $100,880 |
| 2024 | $2,036 | $101,200 | $20,000 | $81,200 |
| 2023 | $789 | $90,240 | $12,000 | $78,240 |
| 2022 | $648 | $53,080 | $9,600 | $43,480 |
| 2021 | $1,586 | $41,000 | $4,800 | $36,200 |
| 2020 | $1,098 | $40,800 | $4,800 | $36,000 |
| 2019 | $1,623 | $40,800 | $4,800 | $36,000 |
| 2018 | $1,086 | $40,400 | $4,800 | $35,600 |
| 2017 | $828 | $34,560 | $4,080 | $30,480 |
| 2016 | $819 | $34,360 | $4,080 | $30,280 |
| 2015 | $1,506 | $40,520 | $4,080 | $36,440 |
| 2014 | $2,139 | $43,520 | $0 | $0 |
Source: Public Records
Map
Nearby Homes
- 2120 Vermont Ave
- 2129 Indiana Ave
- 2131 Indiana Ave
- 2203 Skidaway Rd
- 2011 E 38th St
- 102 Bent Oaks Dr
- 2016 Indiana Ave
- 2413 Wessels Ave
- 2148 Tennessee Ave
- 2310 E 40th St
- 2305 E 40th St
- 2033 E 41st St
- 2408 E 37th St Unit C
- 2408 E 37th St Unit B
- 2408 E 37th St Unit A
- 2409 E 37th St
- 2141 New York Ave
- 616 Virginia Ave
- 2237 E 42nd St
- 2125 Florida Ave
- 1301 Bonaventure Rd
- 1203 Bonaventure Rd
- 2132 E 37th St
- 2130 E 37th St
- 1206 Bonaventure Rd
- 2202 E 37th St
- 1305 Bonaventure Rd
- 1302 Bonaventure Rd
- 2126 E 37th St
- 1204 Bonaventure Rd
- 1304 Bonaventure Rd
- 1201 Bonaventure Rd
- 2206 E 37th St
- 1202 Bonaventure Rd
- 1306 Bonaventure Rd
- 1307 Bonaventure Rd
- 2208 E 37th St
- 2015 Wessels Ave
- 2015 Wessels Arbor
- 2111 E 36th St