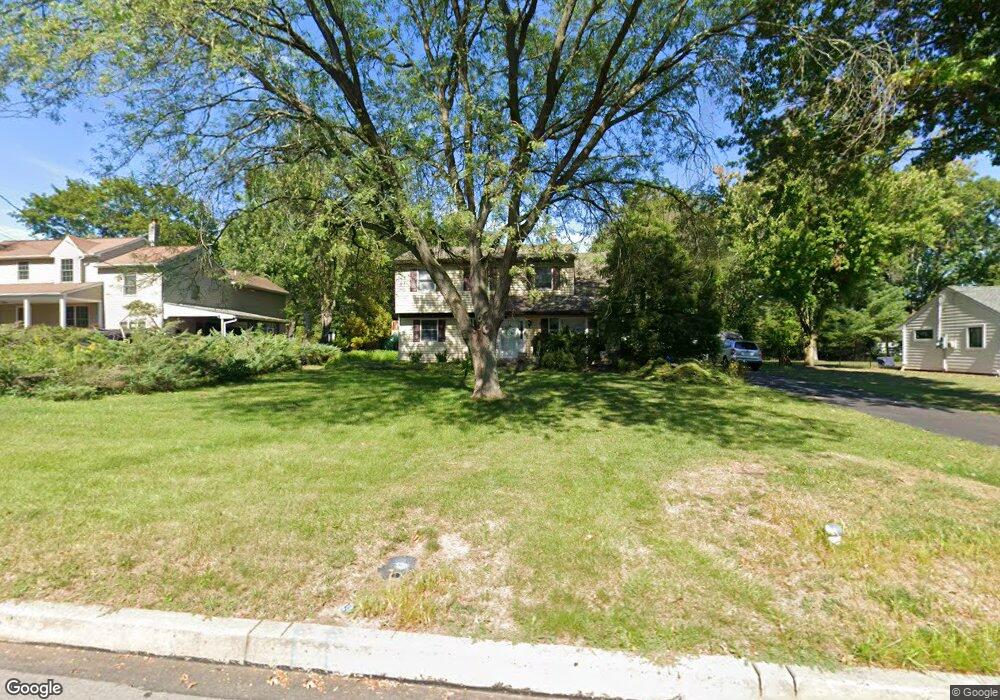
1211 Cabin Rd Hatfield, PA 19440
Estimated Value: $432,536 - $460,000
3
Beds
2
Baths
1,920
Sq Ft
$233/Sq Ft
Est. Value
About This Home
This home is located at 1211 Cabin Rd, Hatfield, PA 19440 and is currently estimated at $446,884, approximately $232 per square foot. 1211 Cabin Rd is a home located in Montgomery County with nearby schools including Oak Park El School, Pennfield Middle School, and North Penn Senior High School.
Ownership History
Date
Name
Owned For
Owner Type
Purchase Details
Closed on
Aug 28, 2020
Sold by
Saraga Melissa
Bought by
Saraga Melissa and Saraga Jared D
Current Estimated Value
Purchase Details
Closed on
Dec 4, 2013
Sold by
Wooters Michael O and Wooters Melissa A
Bought by
Wooters Melissa A
Home Financials for this Owner
Home Financials are based on the most recent Mortgage that was taken out on this home.
Original Mortgage
$208,000
Outstanding Balance
$155,097
Interest Rate
4.15%
Mortgage Type
New Conventional
Estimated Equity
$291,787
Purchase Details
Closed on
Jun 18, 2004
Sold by
Ray Richard J and Ray Stacy A
Bought by
Wooters Michael O and Wooters Melissa A
Home Financials for this Owner
Home Financials are based on the most recent Mortgage that was taken out on this home.
Original Mortgage
$40,000
Interest Rate
6.3%
Purchase Details
Closed on
Jan 22, 1999
Sold by
Mahoney Christopher P and Mahoney Diane C
Bought by
Ray Richard J and Ray Stacy A
Create a Home Valuation Report for This Property
The Home Valuation Report is an in-depth analysis detailing your home's value as well as a comparison with similar homes in the area
Home Values in the Area
Average Home Value in this Area
Purchase History
| Date | Buyer | Sale Price | Title Company |
|---|---|---|---|
| Saraga Melissa | -- | None Available | |
| Wooters Melissa A | -- | None Available | |
| Wooters Michael O | $225,000 | -- | |
| Ray Richard J | $149,000 | -- |
Source: Public Records
Mortgage History
| Date | Status | Borrower | Loan Amount |
|---|---|---|---|
| Open | Wooters Melissa A | $208,000 | |
| Closed | Wooters Michael O | $40,000 |
Source: Public Records
Tax History Compared to Growth
Tax History
| Year | Tax Paid | Tax Assessment Tax Assessment Total Assessment is a certain percentage of the fair market value that is determined by local assessors to be the total taxable value of land and additions on the property. | Land | Improvement |
|---|---|---|---|---|
| 2025 | $4,534 | $113,280 | $48,370 | $64,910 |
| 2024 | $4,534 | $113,280 | $48,370 | $64,910 |
| 2023 | $4,340 | $113,280 | $48,370 | $64,910 |
| 2022 | $4,199 | $113,280 | $48,370 | $64,910 |
| 2021 | $4,080 | $113,280 | $48,370 | $64,910 |
| 2020 | $3,984 | $113,280 | $48,370 | $64,910 |
| 2019 | $3,917 | $113,280 | $48,370 | $64,910 |
| 2018 | $3,917 | $113,280 | $48,370 | $64,910 |
| 2017 | $3,768 | $113,280 | $48,370 | $64,910 |
| 2016 | $3,723 | $113,280 | $48,370 | $64,910 |
| 2015 | $3,574 | $113,280 | $48,370 | $64,910 |
| 2014 | $3,574 | $113,280 | $48,370 | $64,910 |
Source: Public Records
Map
Nearby Homes
- 1226 Cabin Rd
- 1306 W Orvilla Rd
- 1315 Deer Run Rd
- 732 Cowpath Rd
- 1744 Lydia Dr
- 2317 E Orvilla Rd
- 480 Bentwood Dr
- 109 Hickory Dr
- 113 Hickory Dr
- 9 Fortuna Dr
- 8 Fortuna Dr
- 5 Fortuna Dr
- 6 Fortuna Dr
- 105 S Main St
- 24 S Wayne Ave
- 302 W Broad St
- 1028 Poplar St Unit 75
- 816 Kenilworth Ave
- 1035 Forest Ave
- 3 Diamond St