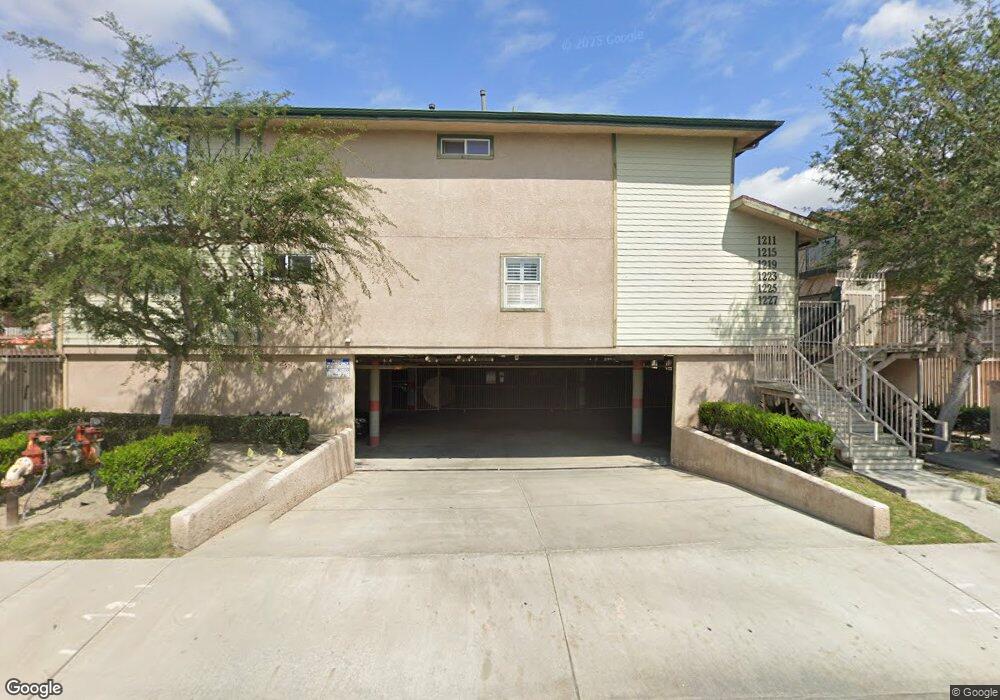
1211 E Carson St Unit 26 Carson, CA 90745
Estimated Value: $542,000 - $590,000
2
Beds
2
Baths
1,350
Sq Ft
$422/Sq Ft
Est. Value
About This Home
This home is located at 1211 E Carson St Unit 26, Carson, CA 90745 and is currently estimated at $569,317, approximately $421 per square foot. 1211 E Carson St Unit 26 is a home located in Los Angeles County with nearby schools including Del Amo Elementary School, Andrew Carnegie Middle School, and Rancho Dominguez Preparatory School.
Ownership History
Date
Name
Owned For
Owner Type
Purchase Details
Closed on
Sep 26, 2014
Sold by
S & A Gradney Investments Llc
Bought by
Siam Gradney Investments Llc
Current Estimated Value
Purchase Details
Closed on
Jan 13, 2009
Sold by
Gradney Stephen and Gradney Angelique
Bought by
S & A Gradney Investments Llc
Purchase Details
Closed on
Mar 5, 2008
Sold by
Gradney Stephen
Bought by
Gradney Stephen and Gradney Angelique
Home Financials for this Owner
Home Financials are based on the most recent Mortgage that was taken out on this home.
Original Mortgage
$297,500
Interest Rate
5.65%
Mortgage Type
New Conventional
Purchase Details
Closed on
May 18, 2005
Sold by
Vista Del Montano Llc
Bought by
Gradney Stephen
Home Financials for this Owner
Home Financials are based on the most recent Mortgage that was taken out on this home.
Original Mortgage
$292,000
Interest Rate
1%
Mortgage Type
Fannie Mae Freddie Mac
Create a Home Valuation Report for This Property
The Home Valuation Report is an in-depth analysis detailing your home's value as well as a comparison with similar homes in the area
Home Values in the Area
Average Home Value in this Area
Purchase History
| Date | Buyer | Sale Price | Title Company |
|---|---|---|---|
| Siam Gradney Investments Llc | -- | Accommodation | |
| S & A Gradney Investments Llc | -- | Fnt | |
| Gradney Stephen | -- | Lawyers Title | |
| Gradney Stephen | $365,000 | Stewart Title |
Source: Public Records
Mortgage History
| Date | Status | Borrower | Loan Amount |
|---|---|---|---|
| Previous Owner | Gradney Stephen | $297,500 | |
| Previous Owner | Gradney Stephen | $292,000 |
Source: Public Records
Tax History
| Year | Tax Paid | Tax Assessment Tax Assessment Total Assessment is a certain percentage of the fair market value that is determined by local assessors to be the total taxable value of land and additions on the property. | Land | Improvement |
|---|---|---|---|---|
| 2025 | $4,981 | $390,593 | $270,412 | $120,181 |
| 2024 | $4,981 | $382,935 | $265,110 | $117,825 |
| 2023 | $4,892 | $375,427 | $259,912 | $115,515 |
| 2022 | $4,652 | $368,066 | $254,816 | $113,250 |
| 2021 | $4,600 | $360,850 | $249,820 | $111,030 |
| 2019 | $4,453 | $350,149 | $242,411 | $107,738 |
| 2018 | $4,403 | $343,284 | $237,658 | $105,626 |
| 2016 | $3,735 | $290,000 | $115,500 | $174,500 |
| 2015 | $3,488 | $270,000 | $107,500 | $162,500 |
| 2014 | $3,179 | $239,000 | $95,200 | $143,800 |
Source: Public Records
Map
Nearby Homes
- 21711 Vera St Unit 8
- 1502 E Carson St Unit 114
- 1501 E Carson St Unit 7
- 21992 Acarus Ave
- 21930 Ackmar Ave
- 21829 Legend Ave
- 21900 Martin St Unit A8
- 1657 E 218th St
- 814 E Calbas St
- 807 E Calbas St
- 22025 Garston Ave
- 21235 Oakfort Ave
- 21425 S Avalon Blvd Unit 22
- 707 Colorado Cir
- 21730 Grace Ave Unit 2
- 536 E 220th St
- 22108 Avalon Blvd
- 563 E 223rd St
- 618 E 225th St
- 21826 Ravenna Ave
- 1211 E Carson St Unit 28
- 1211 E Carson St Unit 25
- 1211 E Carson St Unit 24
- 1215 E Carson St Unit 23
- 1215 E Carson St Unit 22
- 1215 E Carson St Unit 21
- 1215 E Carson St Unit 18
- 1215 E Carson St Unit 19
- 1215 E Carson St Unit 20
- 1229 E Carson St Unit 3
- 1229 E Carson St Unit 2
- 1229 E Carson St Unit 1
- 1209 E Carson St
- 1235 E Carson St
- 1235 E Carson St Unit B
- 1235 E Carson St Unit 1
- 1235 E Carson St Unit 2
- 1235 E Carson St Unit 3
- 1235 E Carson St Unit 4
- 1235 E Carson St Unit 5
Your Personal Tour Guide
Ask me questions while you tour the home.