1211 Fran St Evansdale, IA 50707
Estimated Value: $300,142 - $410,000
4
Beds
4
Baths
1,600
Sq Ft
$219/Sq Ft
Est. Value
About This Home
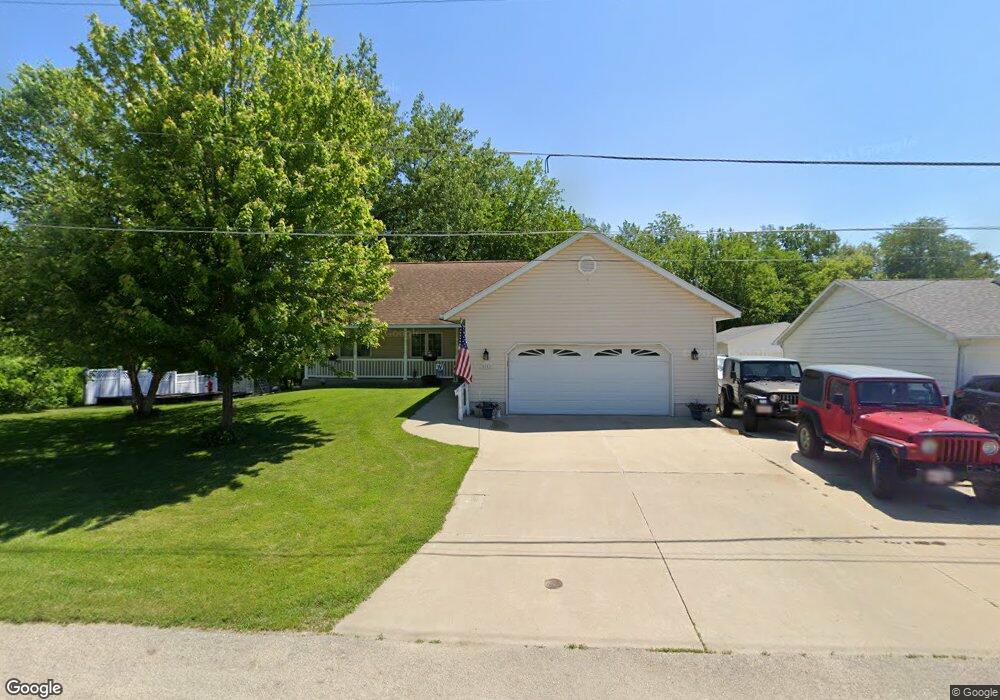
This home is located at 1211 Fran St, Evansdale, IA 50707 and is currently estimated at $351,036, approximately $219 per square foot. 1211 Fran St is a home located in Black Hawk County with nearby schools including Poyner Elementary School, Bunger Middle School, and East High School.
Ownership History
Date
Name
Owned For
Owner Type
Purchase Details
Closed on
Dec 14, 2010
Sold by
Gv City Of Evansdale
Bought by
Billings Edward Ray and Billings Lorrie Ann
Current Estimated Value
Purchase Details
Closed on
Apr 26, 2010
Sold by
Billings Edward R and Billings Lorrie A
Bought by
Billings Edward R and Billings Lorrie A
Home Financials for this Owner
Home Financials are based on the most recent Mortgage that was taken out on this home.
Original Mortgage
$142,500
Interest Rate
5.05%
Mortgage Type
New Conventional
Create a Home Valuation Report for This Property
The Home Valuation Report is an in-depth analysis detailing your home's value as well as a comparison with similar homes in the area
Home Values in the Area
Average Home Value in this Area
Purchase History
| Date | Buyer | Sale Price | Title Company |
|---|---|---|---|
| Billings Edward Ray | -- | None Available | |
| Billings Edward R | -- | None Available |
Source: Public Records
Mortgage History
| Date | Status | Borrower | Loan Amount |
|---|---|---|---|
| Previous Owner | Billings Edward R | $142,500 |
Source: Public Records
Tax History Compared to Growth
Tax History
| Year | Tax Paid | Tax Assessment Tax Assessment Total Assessment is a certain percentage of the fair market value that is determined by local assessors to be the total taxable value of land and additions on the property. | Land | Improvement |
|---|---|---|---|---|
| 2025 | $4,032 | $313,410 | $26,780 | $286,630 |
| 2024 | $4,032 | $290,180 | $26,780 | $263,400 |
| 2023 | $3,286 | $290,180 | $26,780 | $263,400 |
| 2022 | $3,262 | $220,400 | $26,780 | $193,620 |
| 2021 | $3,262 | $220,400 | $26,780 | $193,620 |
| 2020 | $3,236 | $204,850 | $21,420 | $183,430 |
| 2019 | $3,236 | $204,850 | $21,420 | $183,430 |
| 2018 | $3,352 | $204,850 | $21,420 | $183,430 |
| 2017 | $3,390 | $204,850 | $21,420 | $183,430 |
| 2016 | $3,338 | $204,850 | $21,420 | $183,430 |
| 2015 | $3,338 | $204,850 | $21,420 | $183,430 |
| 2014 | $3,184 | $194,660 | $21,420 | $173,240 |
Source: Public Records
Map
Nearby Homes