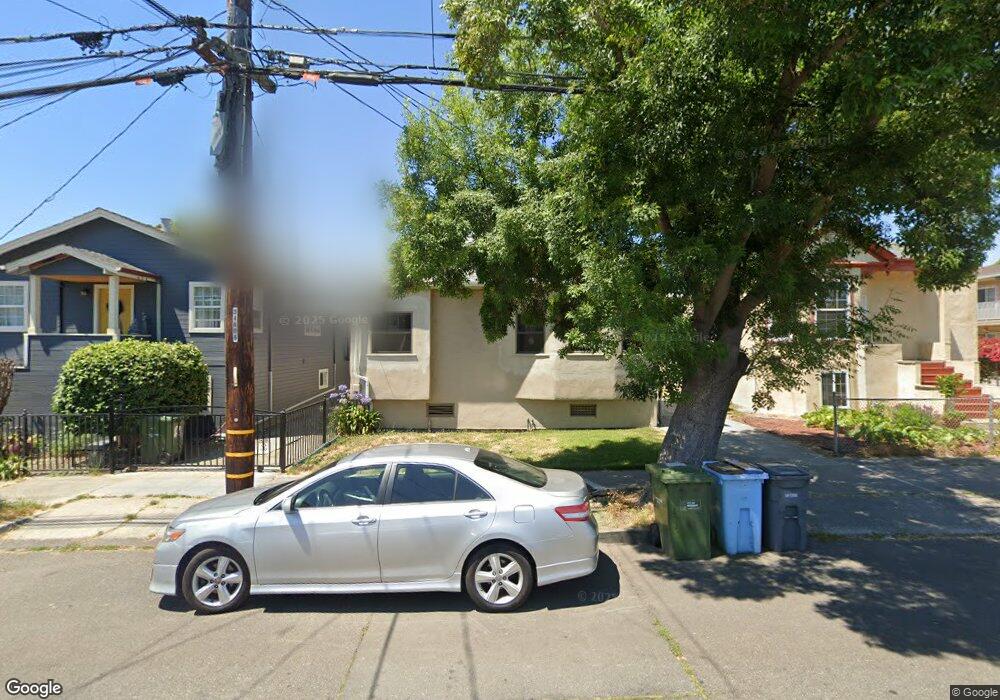
1211 Haskell St Berkeley, CA 94702
West Berkeley NeighborhoodEstimated Value: $834,733 - $1,132,000
2
Beds
2
Baths
1,307
Sq Ft
$747/Sq Ft
Est. Value
About This Home
This home is located at 1211 Haskell St, Berkeley, CA 94702 and is currently estimated at $976,683, approximately $747 per square foot. 1211 Haskell St is a home located in Alameda County with nearby schools including Malcolm X Elementary School, Oxford Elementary School, and Washington Elementary School.
Ownership History
Date
Name
Owned For
Owner Type
Purchase Details
Closed on
Jul 11, 2016
Sold by
Polymathic Properties Inc
Bought by
Bishop Andrew J and Clark Catherine L
Current Estimated Value
Home Financials for this Owner
Home Financials are based on the most recent Mortgage that was taken out on this home.
Original Mortgage
$536,300
Outstanding Balance
$428,405
Interest Rate
3.6%
Mortgage Type
New Conventional
Estimated Equity
$548,278
Purchase Details
Closed on
Feb 2, 2016
Sold by
Taylor Smith Connie Ruth
Bought by
Polymathic Properties Inc
Purchase Details
Closed on
Jan 4, 2016
Sold by
Taylor Velma and Taylor Bennie
Bought by
Taylor Smith Connie Ruth
Purchase Details
Closed on
Apr 23, 2001
Sold by
Taylor Bennie L and Taylor Velma L
Bought by
Taylor Velma and Taylor Bennie
Purchase Details
Closed on
Jan 13, 1997
Sold by
Taylor Bennie L
Bought by
Taylor Bennie L and Taylor Velma L
Create a Home Valuation Report for This Property
The Home Valuation Report is an in-depth analysis detailing your home's value as well as a comparison with similar homes in the area
Home Values in the Area
Average Home Value in this Area
Purchase History
| Date | Buyer | Sale Price | Title Company |
|---|---|---|---|
| Bishop Andrew J | $565,000 | Chicago Title Company | |
| Polymathic Properties Inc | $392,000 | Lawyers Title Company | |
| Taylor Smith Connie Ruth | -- | First American Title Company | |
| Taylor Velma | -- | -- | |
| Taylor Bennie L | -- | -- |
Source: Public Records
Mortgage History
| Date | Status | Borrower | Loan Amount |
|---|---|---|---|
| Open | Bishop Andrew J | $536,300 |
Source: Public Records
Tax History
| Year | Tax Paid | Tax Assessment Tax Assessment Total Assessment is a certain percentage of the fair market value that is determined by local assessors to be the total taxable value of land and additions on the property. | Land | Improvement |
|---|---|---|---|---|
| 2025 | $13,591 | $772,157 | $406,196 | $372,961 |
| 2024 | $13,591 | $756,882 | $398,233 | $365,649 |
| 2023 | $13,249 | $748,905 | $390,425 | $358,480 |
| 2022 | $13,150 | $727,222 | $382,770 | $351,452 |
| 2021 | $13,165 | $712,828 | $375,266 | $344,562 |
| 2020 | $12,469 | $712,451 | $371,420 | $341,031 |
| 2019 | $11,969 | $698,485 | $364,140 | $334,345 |
| 2018 | $11,002 | $608,790 | $357,000 | $251,790 |
| 2017 | $9,538 | $564,500 | $350,000 | $214,500 |
| 2016 | $3,058 | $38,108 | $27,753 | $10,355 |
| 2015 | $2,964 | $37,536 | $27,336 | $10,200 |
| 2014 | $2,542 | $36,801 | $26,801 | $10,000 |
Source: Public Records
Map
Nearby Homes
- 1080 67th St
- 6628 Helen Ct
- 3032 Mabel St
- 1237 Ashby Ave
- 6500 San Pablo Ave
- 6501 San Pablo Ave Unit 410
- 1314 Ashby Ave
- 6465 San Pablo Ave Unit 203
- 1126 Ocean Ave
- 1164 Ocean Ave
- 1200 65th St Unit 224
- 1156 64th St
- 1161 64th St
- 1124 63rd St
- 2922 Stanton St
- 3101 Sacramento St
- 1507 Prince St
- 2751 Wallace St
- 3224 Sacramento St
- 2747 San Pablo Ave Unit 507
- 1209 Haskell St
- 1213 Haskell St
- 1207 Haskell St
- 1217 Haskell St Unit 4
- 1217 Haskell St
- 1217 Haskell St Unit 6
- 1205 Haskell St
- 1206 Carrison St
- 1200 Carrison St
- 1212 Carrison St
- 1198 Carrison St
- 1203 Haskell St
- 1235 Haskell St
- 1224 Haskell St
- 1220 Haskell St
- 1220 Haskell St
- 1196 Carrison St
- 1218 Haskell St
- 1218 Haskell St
- 1214 Carrison St
Your Personal Tour Guide
Ask me questions while you tour the home.