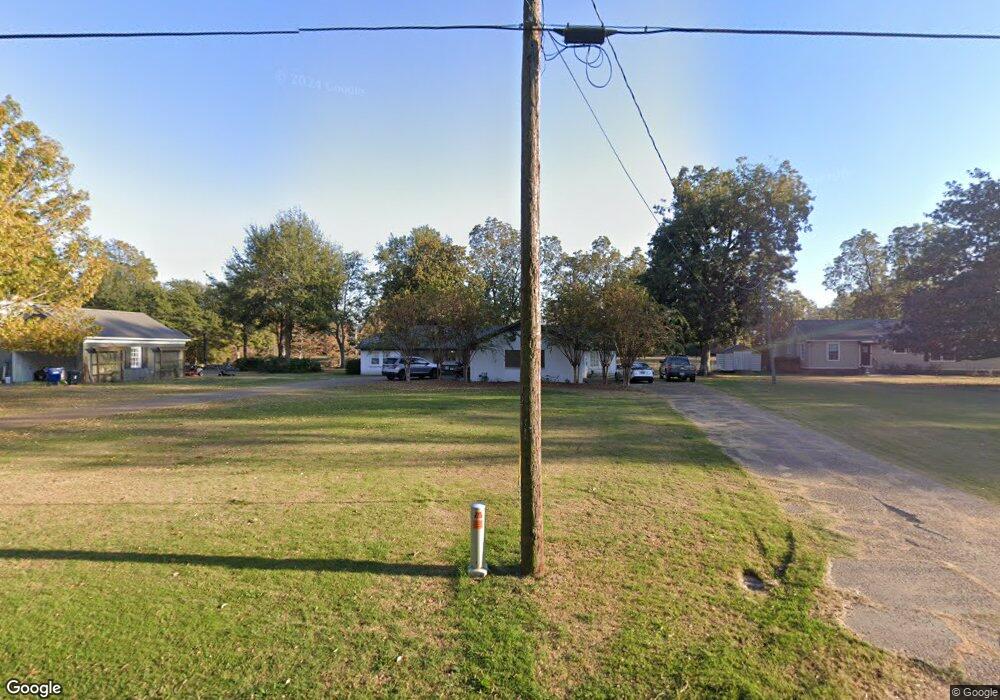
1211 Montgomery Dr Inverness, MS 38753
Estimated Value: $144,863 - $197,000
3
Beds
--
Bath
2,598
Sq Ft
$64/Sq Ft
Est. Value
About This Home
This home is located at 1211 Montgomery Dr, Inverness, MS 38753 and is currently estimated at $165,466, approximately $63 per square foot. 1211 Montgomery Dr is a home with nearby schools including Rosser Early Learning Center, A.W. James Elementary School, and Moorhead Central School.
Ownership History
Date
Name
Owned For
Owner Type
Purchase Details
Closed on
Oct 27, 2022
Sold by
Soen Sara Emily
Bought by
Smallwood Mason and Smallwood Justin
Current Estimated Value
Home Financials for this Owner
Home Financials are based on the most recent Mortgage that was taken out on this home.
Original Mortgage
$201,286
Outstanding Balance
$194,753
Interest Rate
6.7%
Mortgage Type
FHA
Estimated Equity
-$29,287
Purchase Details
Closed on
Jan 10, 2022
Sold by
Walker Tony and Walker Cary
Bought by
Soen Sara Emily
Home Financials for this Owner
Home Financials are based on the most recent Mortgage that was taken out on this home.
Original Mortgage
$164,000
Interest Rate
3.11%
Mortgage Type
New Conventional
Purchase Details
Closed on
Jan 11, 2019
Sold by
Donahue Carey Joe
Bought by
Walker Tony and Walker Cary
Home Financials for this Owner
Home Financials are based on the most recent Mortgage that was taken out on this home.
Original Mortgage
$169,866
Interest Rate
5.12%
Mortgage Type
FHA
Create a Home Valuation Report for This Property
The Home Valuation Report is an in-depth analysis detailing your home's value as well as a comparison with similar homes in the area
Home Values in the Area
Average Home Value in this Area
Purchase History
| Date | Buyer | Sale Price | Title Company |
|---|---|---|---|
| Smallwood Mason | $203,298 | None Listed On Document | |
| Soen Sara Emily | -- | None Available | |
| Walker Tony | -- | None Available |
Source: Public Records
Mortgage History
| Date | Status | Borrower | Loan Amount |
|---|---|---|---|
| Open | Smallwood Mason | $201,286 | |
| Previous Owner | Soen Sara Emily | $164,000 | |
| Previous Owner | Walker Tony | $169,866 |
Source: Public Records
Tax History Compared to Growth
Tax History
| Year | Tax Paid | Tax Assessment Tax Assessment Total Assessment is a certain percentage of the fair market value that is determined by local assessors to be the total taxable value of land and additions on the property. | Land | Improvement |
|---|---|---|---|---|
| 2024 | $1,030 | $10,999 | $1,600 | $9,399 |
| 2023 | $1,030 | $10,999 | $1,600 | $9,399 |
| 2022 | $1,039 | $10,999 | $1,600 | $9,399 |
| 2021 | $921 | $10,421 | $1,600 | $8,821 |
| 2020 | $921 | $10,421 | $1,600 | $8,821 |
| 2019 | $1,831 | $15,631 | $2,400 | $13,231 |
| 2018 | $921 | $10,421 | $1,600 | $8,821 |
| 2017 | $1,780 | $10,092 | $1,600 | $8,492 |
| 2016 | $1,780 | $15,137 | $2,400 | $12,737 |
| 2015 | -- | $9,762 | $1,600 | $8,162 |
| 2014 | -- | $9,762 | $1,600 | $8,162 |
| 2013 | -- | $9,364 | $1,600 | $7,764 |
Source: Public Records
Map
Nearby Homes
- 1213 Oak St
- 808 Marshall St
- 99 Duncan Rd
- 11 Shannon Ferguson Cove
- 635 Jefferson St
- 135 Baird Ave
- 514 Lincoln Ave
- 4 Little Cir
- 1400 Bayou Dr
- 301 Hampton St
- 602 Magnolia Dr
- 130 Lee Cir
- 407 E Percy St
- 204 Cypress Dr
- 207 E Percy St
- 314 Jackson St
- 107 & 109 E Percy St
- 207 W Percy St
- 0 E 82 Hwy Unit 4122425
- 111 E Gresham St
- 1213 Montgomery Dr
- 1209 Montgomery Dr
- 1214 Montgomery Dr
- 1212 Montgomery Dr
- 1210 Montgomery Dr
- 1216 Montgomery Dr
- 1205 Montgomery Dr
- 1208 Montgomery Dr
- 1220 Montgomery Dr
- 1221 Montgomery Dr
- 1201 Montgomery Dr
- 1204 Montgomery Dr
- 1301 Pond Ave
- 1303 Pond Ave
- 1222 Montgomery Dr
- 1200 Montgomery Dr
- 1305 Pond Ave
- 1113 Montgomery Dr
- 1203 Pond Ave
- 1223 Montgomery Dr