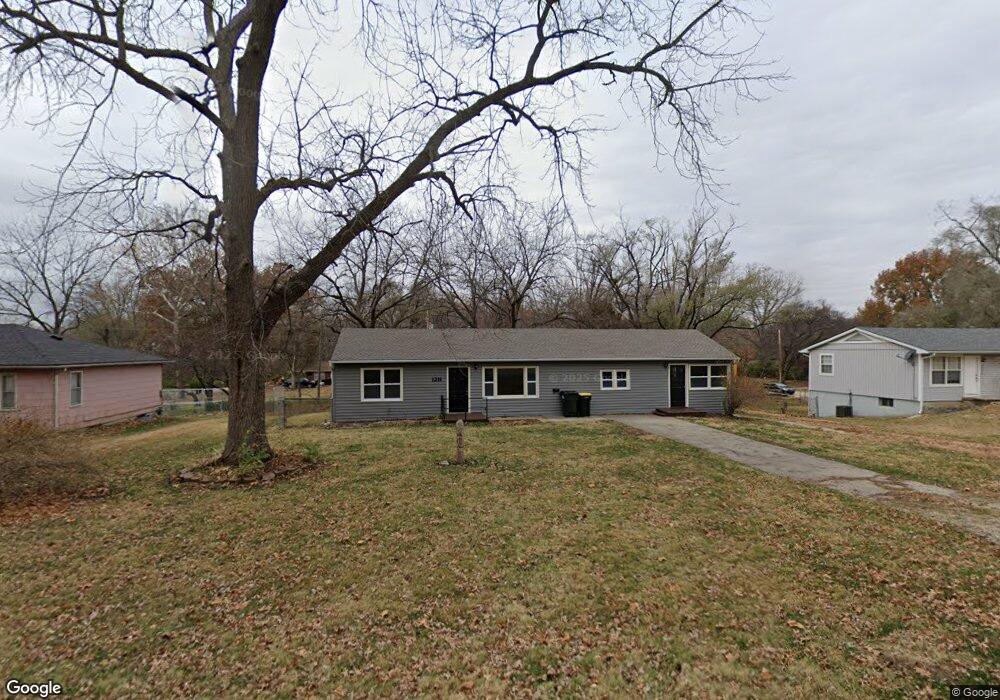
1211 N 7th St Lansing, KS 66043
Estimated Value: $207,087 - $219,000
4
Beds
2
Baths
1,784
Sq Ft
$119/Sq Ft
Est. Value
About This Home
This home is located at 1211 N 7th St, Lansing, KS 66043 and is currently estimated at $212,696, approximately $119 per square foot. 1211 N 7th St is a home located in Leavenworth County with nearby schools including Lansing Elementary School, Lansing Middle 6-8, and Lansing High 9-12.
Ownership History
Date
Name
Owned For
Owner Type
Purchase Details
Closed on
Jun 14, 2023
Sold by
Cityscape Properties Llc
Bought by
Jc Management Group Llc
Current Estimated Value
Home Financials for this Owner
Home Financials are based on the most recent Mortgage that was taken out on this home.
Original Mortgage
$1,070,000
Outstanding Balance
$1,041,388
Interest Rate
6.39%
Mortgage Type
New Conventional
Estimated Equity
-$828,692
Purchase Details
Closed on
Apr 13, 2022
Sold by
Jackson Timothy L and Jackson Debbie A
Bought by
Cityscape Properties Llc
Home Financials for this Owner
Home Financials are based on the most recent Mortgage that was taken out on this home.
Original Mortgage
$138,750
Interest Rate
4.72%
Mortgage Type
New Conventional
Create a Home Valuation Report for This Property
The Home Valuation Report is an in-depth analysis detailing your home's value as well as a comparison with similar homes in the area
Home Values in the Area
Average Home Value in this Area
Purchase History
| Date | Buyer | Sale Price | Title Company |
|---|---|---|---|
| Jc Management Group Llc | -- | Alpha Title | |
| Cityscape Properties Llc | -- | New Title Company Name |
Source: Public Records
Mortgage History
| Date | Status | Borrower | Loan Amount |
|---|---|---|---|
| Open | Jc Management Group Llc | $1,070,000 | |
| Previous Owner | Cityscape Properties Llc | $138,750 |
Source: Public Records
Tax History Compared to Growth
Tax History
| Year | Tax Paid | Tax Assessment Tax Assessment Total Assessment is a certain percentage of the fair market value that is determined by local assessors to be the total taxable value of land and additions on the property. | Land | Improvement |
|---|---|---|---|---|
| 2025 | $2,624 | $21,500 | $2,458 | $19,042 |
| 2024 | $2,464 | $20,093 | $2,458 | $17,635 |
| 2023 | $2,464 | $19,320 | $2,331 | $16,989 |
| 2022 | $2,394 | $17,732 | $2,068 | $15,664 |
| 2021 | $995 | $7,153 | $2,068 | $5,085 |
| 2020 | $825 | $5,888 | $2,068 | $3,820 |
| 2019 | $826 | $5,888 | $2,068 | $3,820 |
| 2018 | $1,029 | $7,263 | $2,068 | $5,195 |
| 2017 | $1,000 | $7,051 | $2,068 | $4,983 |
| 2016 | $990 | $6,981 | $2,068 | $4,913 |
| 2015 | $1,011 | $7,142 | $2,068 | $5,074 |
| 2014 | $990 | $7,142 | $2,068 | $5,074 |
Source: Public Records
Map
Nearby Homes
- 603 E Beth St
- 1102 N 4th St
- 1100 N 4th St
- 4 Eisenhower Rd
- 1102 N Main St
- 268 Holiday Dr
- 129 Brookwood St
- 415 Fairlane St
- 129 Crestview Ct
- 310 E Kansas Ave
- 3405 Iowa St
- 20958 Ida St
- 306 E Kay St
- 218 E Kay St
- 63 Logan St
- 542 Creekside Ct
- 3532 Lakeview Dr
- 124 S Main St
- 202 S Main St
- 4036 Shrine Park Rd