1211 N El Cajon St Visalia, CA 93291
Northwest Visalia NeighborhoodEstimated Value: $1,123,000 - $1,231,447
5
Beds
5
Baths
4,448
Sq Ft
$262/Sq Ft
Est. Value
About This Home
This home is located at 1211 N El Cajon St, Visalia, CA 93291 and is currently estimated at $1,166,482, approximately $262 per square foot. 1211 N El Cajon St is a home located in Tulare County with nearby schools including Hurley Elementary School, Ridgeview Middle, and Redwood High School.
Ownership History
Date
Name
Owned For
Owner Type
Purchase Details
Closed on
Feb 27, 2019
Sold by
Trevino Jose R and Trevino Raquel R
Bought by
Trevino Rigoel R and Trevino Bettina
Current Estimated Value
Home Financials for this Owner
Home Financials are based on the most recent Mortgage that was taken out on this home.
Original Mortgage
$200,000
Outstanding Balance
$175,476
Interest Rate
4.3%
Mortgage Type
Unknown
Estimated Equity
$991,006
Purchase Details
Closed on
Jul 31, 2002
Sold by
Mejia Marta E
Bought by
Trevino Jose R and Trevino Raquel R
Home Financials for this Owner
Home Financials are based on the most recent Mortgage that was taken out on this home.
Original Mortgage
$44,000
Interest Rate
6.37%
Purchase Details
Closed on
Mar 21, 2001
Sold by
The Hosfeldt Family Trust
Bought by
Mejia Marta E
Home Financials for this Owner
Home Financials are based on the most recent Mortgage that was taken out on this home.
Original Mortgage
$70,400
Interest Rate
7.14%
Create a Home Valuation Report for This Property
The Home Valuation Report is an in-depth analysis detailing your home's value as well as a comparison with similar homes in the area
Home Values in the Area
Average Home Value in this Area
Purchase History
| Date | Buyer | Sale Price | Title Company |
|---|---|---|---|
| Trevino Rigoel R | -- | None Available | |
| Trevino Jose R | $86,000 | Chicago Title Co | |
| Mejia Marta E | $88,000 | Chicago Title Co |
Source: Public Records
Mortgage History
| Date | Status | Borrower | Loan Amount |
|---|---|---|---|
| Open | Trevino Rigoel R | $200,000 | |
| Previous Owner | Trevino Jose R | $44,000 | |
| Previous Owner | Mejia Marta E | $70,400 |
Source: Public Records
Tax History Compared to Growth
Tax History
| Year | Tax Paid | Tax Assessment Tax Assessment Total Assessment is a certain percentage of the fair market value that is determined by local assessors to be the total taxable value of land and additions on the property. | Land | Improvement |
|---|---|---|---|---|
| 2025 | $8,727 | $830,637 | $124,554 | $706,083 |
| 2024 | $8,727 | $814,351 | $122,112 | $692,239 |
| 2023 | $8,487 | $798,384 | $119,718 | $678,666 |
| 2022 | $8,226 | $782,730 | $117,371 | $665,359 |
| 2021 | $8,119 | $767,383 | $115,070 | $652,313 |
| 2020 | $7,561 | $710,071 | $113,887 | $596,184 |
| 2019 | $7,310 | $696,148 | $111,654 | $584,494 |
| 2018 | $7,159 | $682,498 | $109,465 | $573,033 |
| 2017 | $6,892 | $654,091 | $107,318 | $546,773 |
| 2016 | $6,797 | $641,266 | $105,214 | $536,052 |
| 2015 | $5,519 | $527,946 | $103,634 | $424,312 |
| 2014 | $5,519 | $517,604 | $101,604 | $416,000 |
Source: Public Records
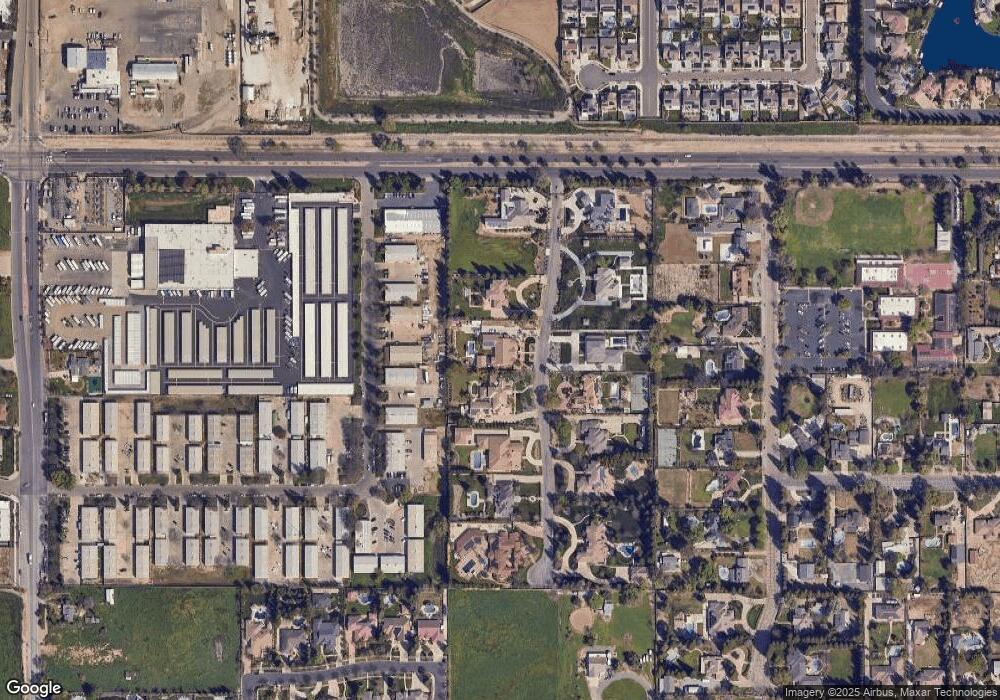
Map
Nearby Homes
- Sparrow Plan at Shepherds Ranch
- Lark Plan at Shepherds Ranch
- Wren Plan at Shepherds Ranch
- Oriole Plan at Shepherds Ranch
- 707 N Branson Ct
- 5837 W Stewart Ave
- 6040 W Hurley Ave
- 6310 W Harold Ave
- 5721 W Prospect Dr
- 1617 N Aspen Ct
- 5701 W Buena Vista Ave
- 245 N Boise St
- 5503 W Sweet Dr
- 5614 W Prospect Dr
- 6229 W Ceres Ave
- 5502 W Nicholas Ct
- 6211 W Thompson Ave
- 1536 N Tamarack St
- 415 N Akers St Unit 50
- 415 N Akers St Unit 117
- 1235 N El Cajon St
- 1139 N El Cajon St
- 1307 N El Cajon St
- 1210 N El Cajon St
- 1115 N El Cajon St
- 1140 N El Cajon St
- 1234 N El Cajon St
- 1329 N El Cajon St
- 1120 N El Cajon St
- 1048 N El Cajon St
- 1326 N El Cajon St
- 1048 N Marcin St
- 1028 N El Cajon St
- 1017 N El Cajon St
- 1006 N El Cajon St
- 1111 Mae Carden St
- 1201 Mae Carden St
- 1211 Mae Carden St
- 1133 Mae Carden St
- 1111 Mae Carden St