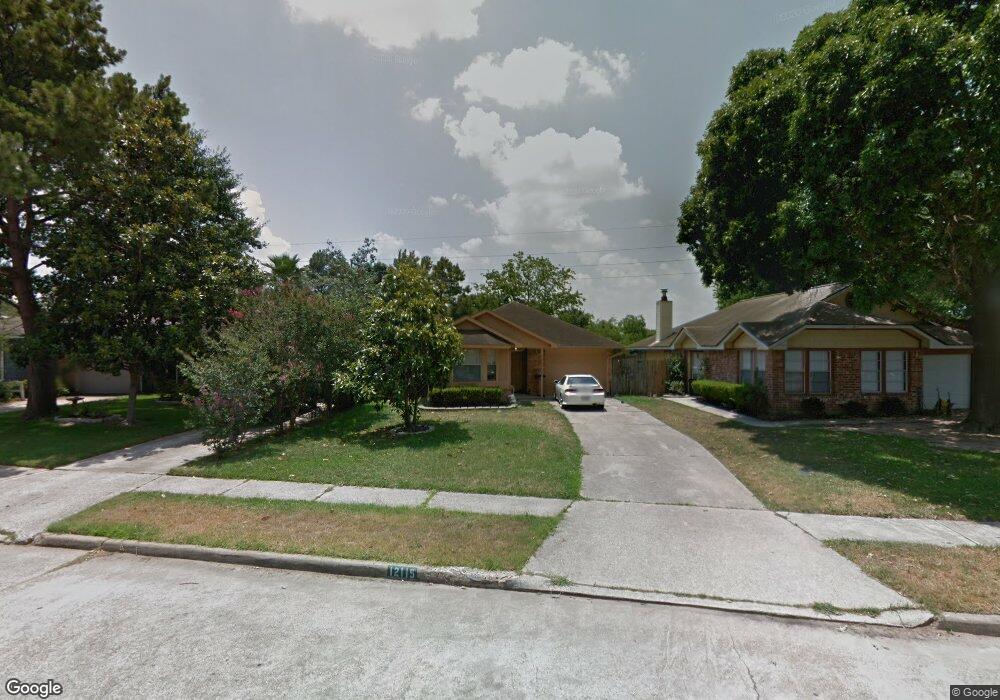
12115 Westwold Dr Tomball, TX 77377
Northpointe NeighborhoodEstimated Value: $208,795 - $221,000
3
Beds
2
Baths
1,140
Sq Ft
$189/Sq Ft
Est. Value
About This Home
This home is located at 12115 Westwold Dr, Tomball, TX 77377 and is currently estimated at $215,199, approximately $188 per square foot. 12115 Westwold Dr is a home located in Harris County with nearby schools including Willow Creek Elementary School, Willow Wood Junior High School, and Northpointe Intermediate School.
Ownership History
Date
Name
Owned For
Owner Type
Purchase Details
Closed on
May 9, 2013
Sold by
Lee Kenneth and Harrison Rebecca J
Bought by
Cuherpin Cheryl F
Current Estimated Value
Purchase Details
Closed on
Jun 5, 2008
Sold by
Mistric Sheila and Mistric Charles
Bought by
Lee Kenneth and Harrison Rebecca J
Purchase Details
Closed on
Jul 23, 2002
Sold by
Hackman Sandra J
Bought by
Sanchez Francisco and Sanchez Elizabeth
Home Financials for this Owner
Home Financials are based on the most recent Mortgage that was taken out on this home.
Original Mortgage
$80,750
Interest Rate
6.69%
Purchase Details
Closed on
Nov 29, 2001
Sold by
Boley Deborah K and Winne Deborah K
Bought by
Mistric Charles and Mistric Sheila
Home Financials for this Owner
Home Financials are based on the most recent Mortgage that was taken out on this home.
Original Mortgage
$74,298
Interest Rate
6.57%
Mortgage Type
FHA
Create a Home Valuation Report for This Property
The Home Valuation Report is an in-depth analysis detailing your home's value as well as a comparison with similar homes in the area
Home Values in the Area
Average Home Value in this Area
Purchase History
| Date | Buyer | Sale Price | Title Company |
|---|---|---|---|
| Cuherpin Cheryl F | -- | Chicago Title | |
| Lee Kenneth | -- | Chicago Title | |
| Sanchez Francisco | -- | Alamo Title Company | |
| Mistric Charles | -- | Alamo Title Company |
Source: Public Records
Mortgage History
| Date | Status | Borrower | Loan Amount |
|---|---|---|---|
| Previous Owner | Sanchez Francisco | $80,750 | |
| Previous Owner | Mistric Charles | $74,298 |
Source: Public Records
Tax History Compared to Growth
Tax History
| Year | Tax Paid | Tax Assessment Tax Assessment Total Assessment is a certain percentage of the fair market value that is determined by local assessors to be the total taxable value of land and additions on the property. | Land | Improvement |
|---|---|---|---|---|
| 2025 | $733 | $186,250 | $40,951 | $145,299 |
| 2024 | $733 | $187,751 | $40,951 | $146,800 |
| 2023 | $733 | $197,852 | $40,951 | $156,901 |
| 2022 | $3,686 | $168,978 | $34,426 | $134,552 |
| 2021 | $3,461 | $134,323 | $31,501 | $102,822 |
| 2020 | $3,406 | $126,440 | $24,751 | $101,689 |
| 2019 | $3,620 | $131,692 | $21,375 | $110,317 |
| 2018 | $1,285 | $120,862 | $16,200 | $104,662 |
| 2017 | $3,228 | $115,174 | $16,200 | $98,974 |
| 2016 | $3,052 | $115,174 | $16,200 | $98,974 |
| 2015 | $2,327 | $104,591 | $16,200 | $88,391 |
| 2014 | $2,327 | $89,980 | $16,200 | $73,780 |
Source: Public Records
Map
Nearby Homes
- 12107 Westwold Dr
- 12046 Westlock Dr
- 12226 Westwold Dr
- 11934 Westwold Dr
- 12242 Westlock Dr
- 12222 Brighton Brook Ln
- 11922 Westwold Dr
- 17814 Winkler Willow Ct
- 12331 Westwold Dr
- 12007 Northpointe Meadows Dr
- 11831 Westlock Dr
- 11902 Oakner Dr
- 18135 Gravenhurst Ln
- 18314 Westlock St
- 12506 Opal Valley Dr
- 17511 Pecks Park Ct
- 12022 Canyon Star Ln
- 17826 Island Spring Ln
- 12006 Canyon Star Ln
- 19307 Hillside Pasture Ln
- 12111 Westwold Dr
- 12119 Westwold Dr
- 12123 Westwold Dr
- 12127 Westwold Dr
- 12103 Westwold Dr
- 12114 Westwold Dr
- 12131 Westwold Dr
- 12110 Westwold Dr
- 12118 Westwold Dr
- 12106 Westwold Dr
- 12122 Westwold Dr
- 12067 Westwold Dr
- 12102 Westwold Dr
- 12135 Westwold Dr
- 12126 Westwold Dr
- 12130 Westwold Dr
- 12063 Westwold Dr
- 12115 Westlock Dr
- 12111 Westlock Dr
- 12134 Westwold Dr