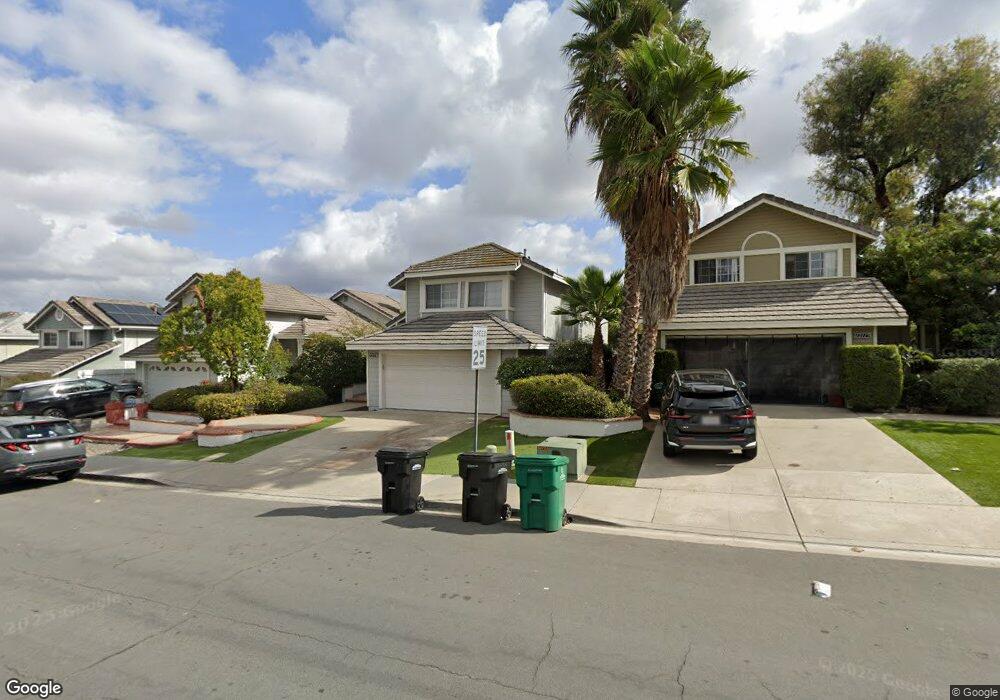
12119 Eastbourne Rd San Diego, CA 92128
Carmel Mountain NeighborhoodEstimated Value: $1,171,121 - $1,308,000
3
Beds
3
Baths
1,634
Sq Ft
$770/Sq Ft
Est. Value
About This Home
This home is located at 12119 Eastbourne Rd, San Diego, CA 92128 and is currently estimated at $1,258,280, approximately $770 per square foot. 12119 Eastbourne Rd is a home located in San Diego County with nearby schools including Highland Ranch Elementary School, Bernardo Heights Middle, and Rancho Bernardo High.
Ownership History
Date
Name
Owned For
Owner Type
Purchase Details
Closed on
Dec 19, 2018
Sold by
Foster Hedy A
Bought by
Kelley John Francis and Kelley Hedy A
Current Estimated Value
Purchase Details
Closed on
Apr 8, 2003
Sold by
Hecker Mason and Hecker Julie
Bought by
Foster David T and Foster Hedy A
Home Financials for this Owner
Home Financials are based on the most recent Mortgage that was taken out on this home.
Original Mortgage
$320,000
Interest Rate
5.84%
Purchase Details
Closed on
Mar 9, 1999
Sold by
Hobart Jerry D and Hobart Kim H
Bought by
Hecker Mason and Hecker Julie
Home Financials for this Owner
Home Financials are based on the most recent Mortgage that was taken out on this home.
Original Mortgage
$210,300
Interest Rate
7.04%
Purchase Details
Closed on
Mar 31, 1989
Create a Home Valuation Report for This Property
The Home Valuation Report is an in-depth analysis detailing your home's value as well as a comparison with similar homes in the area
Home Values in the Area
Average Home Value in this Area
Purchase History
| Date | Buyer | Sale Price | Title Company |
|---|---|---|---|
| Kelley John Francis | -- | None Available | |
| Foster David T | $440,000 | California Title Company | |
| Hecker Mason | $263,000 | Lawyers Title | |
| -- | $231,400 | -- |
Source: Public Records
Mortgage History
| Date | Status | Borrower | Loan Amount |
|---|---|---|---|
| Previous Owner | Foster David T | $320,000 | |
| Previous Owner | Hecker Mason | $210,300 | |
| Closed | Hecker Mason | $26,200 |
Source: Public Records
Tax History Compared to Growth
Tax History
| Year | Tax Paid | Tax Assessment Tax Assessment Total Assessment is a certain percentage of the fair market value that is determined by local assessors to be the total taxable value of land and additions on the property. | Land | Improvement |
|---|---|---|---|---|
| 2025 | $6,706 | $637,247 | $289,659 | $347,588 |
| 2024 | $6,706 | $624,753 | $283,980 | $340,773 |
| 2023 | $6,562 | $612,504 | $278,412 | $334,092 |
| 2022 | $6,462 | $600,495 | $272,953 | $327,542 |
| 2021 | $6,343 | $588,721 | $267,601 | $321,120 |
| 2020 | $6,276 | $582,686 | $264,858 | $317,828 |
| 2019 | $6,117 | $571,262 | $259,665 | $311,597 |
| 2018 | $5,873 | $560,062 | $254,574 | $305,488 |
| 2017 | $5,755 | $549,082 | $249,583 | $299,499 |
| 2016 | $5,637 | $538,317 | $244,690 | $293,627 |
| 2015 | $5,552 | $530,232 | $241,015 | $289,217 |
| 2014 | $5,419 | $519,846 | $236,294 | $283,552 |
Source: Public Records
Map
Nearby Homes
- 14230 Jonah Way
- Residence 3 Plan at The Trails - Lavender
- Residence 6 Plan at The Trails - Lavender
- Residence 1 Plan at The Trails - Lavender
- Residence 4 Plan at The Trails - Lavender
- Residence 2 Plan at The Trails - Lavender
- Residence 5 Plan at The Trails - Lavender
- 14106 Brent Wilsey Place Unit 3
- 11986 Tivoli Park Row
- 12026 Riley Ln
- 12127 Corte Napoli
- 14215 Jonah Way
- 12061 Tivoli Park Row Unit 3
- 12047 Tivoli Park Row Unit 3
- 14346 Savannah Ct
- 12194 Wilsey Way
- 15032 Avenida Venusto Unit 179
- 15048 Avenida Venusto Unit 260
- 12007 Alta Carmel Ct Unit 325
- 12055 Alta Carmel Ct Unit 185
- 12123 Eastbourne Rd
- 12115 Eastbourne Rd
- 12111 Eastbourne Rd
- 12129 Eastbourne Rd
- 12210 Halle Way
- 12107 Eastbourne Rd
- 12135 Eastbourne Rd
- 12141 Eastbourne Rd
- 14380 Savannah Ct
- 14314 Savannah Ct
- 14252 Jonah Way
- 14306 Savannah Ct
- 12130 Riley Ln
- 14234 Jonah Way
- 14232 Jonah Way
- 14248 Jonah Way
- 14268 Jonah Way
- 14270 Jonah Way
- 14003 Lilah Ln Unit 2