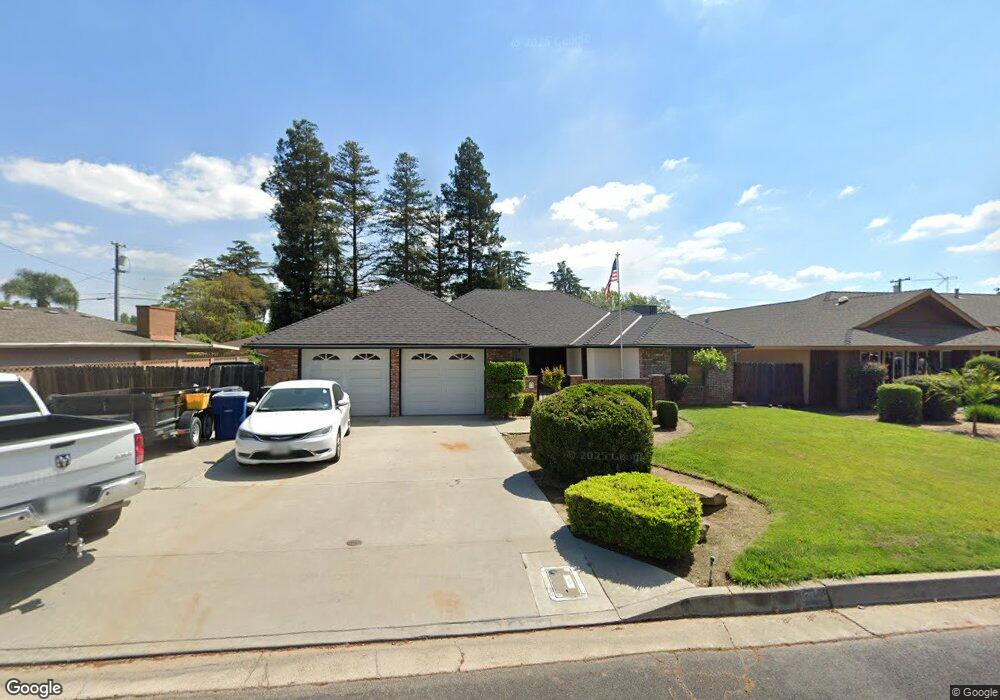
1212 de Cesari Ave Madera, CA 93637
West Madera NeighborhoodEstimated Value: $416,000 - $451,152
2
Beds
2
Baths
1,740
Sq Ft
$245/Sq Ft
Est. Value
About This Home
This home is located at 1212 de Cesari Ave, Madera, CA 93637 and is currently estimated at $426,038, approximately $244 per square foot. 1212 de Cesari Ave is a home located in Madera County with nearby schools including John Adams Elementary School, Thomas Jefferson Middle School, and Madera High School.
Ownership History
Date
Name
Owned For
Owner Type
Purchase Details
Closed on
Mar 4, 2016
Sold by
Garrison Charles M and Garrison Monica A
Bought by
Garrison Charles M
Current Estimated Value
Purchase Details
Closed on
Sep 20, 2007
Sold by
Caballero Sheri Lynn and Richard F & June Gibbs Trust
Bought by
Garrison Charles M and Garrison Monica A
Home Financials for this Owner
Home Financials are based on the most recent Mortgage that was taken out on this home.
Original Mortgage
$165,000
Outstanding Balance
$102,849
Interest Rate
6.27%
Mortgage Type
Purchase Money Mortgage
Estimated Equity
$323,189
Purchase Details
Closed on
Jul 9, 2004
Sold by
Gibbs Richard F and Gibbs June
Bought by
Gibbs Richard F and Gibbs June
Purchase Details
Closed on
Jan 6, 2002
Sold by
Mccamphill Gidreon and Gidreon Mccamphill Trust
Bought by
Gibbs Richard P and Gibbs June
Create a Home Valuation Report for This Property
The Home Valuation Report is an in-depth analysis detailing your home's value as well as a comparison with similar homes in the area
Home Values in the Area
Average Home Value in this Area
Purchase History
| Date | Buyer | Sale Price | Title Company |
|---|---|---|---|
| Garrison Charles M | -- | First American Title Company | |
| Garrison Charles M | $285,000 | Chicago Title Company | |
| Gibbs Richard F | -- | -- | |
| Gibbs Richard P | $130,000 | Chicago Title Co |
Source: Public Records
Mortgage History
| Date | Status | Borrower | Loan Amount |
|---|---|---|---|
| Open | Garrison Charles M | $165,000 |
Source: Public Records
Tax History Compared to Growth
Tax History
| Year | Tax Paid | Tax Assessment Tax Assessment Total Assessment is a certain percentage of the fair market value that is determined by local assessors to be the total taxable value of land and additions on the property. | Land | Improvement |
|---|---|---|---|---|
| 2025 | $4,352 | $374,335 | $131,343 | $242,992 |
| 2023 | $4,352 | $359,801 | $126,244 | $233,557 |
| 2022 | $4,067 | $345,832 | $121,343 | $224,489 |
| 2021 | $3,398 | $294,000 | $50,000 | $244,000 |
| 2020 | $3,040 | $255,273 | $87,462 | $167,811 |
| 2019 | $2,905 | $240,823 | $82,511 | $158,312 |
| 2018 | $2,605 | $229,355 | $78,582 | $150,773 |
| 2017 | $2,502 | $218,433 | $74,840 | $143,593 |
| 2016 | $2,362 | $214,150 | $73,373 | $140,777 |
| 2015 | $2,237 | $203,952 | $69,879 | $134,073 |
| 2014 | $1,949 | $187,112 | $64,109 | $123,003 |
Source: Public Records
Map
Nearby Homes
- 1208 de Cesari Ave
- 1216 de Cesari Ave
- 151 N Park Dr
- 153 N Park Dr
- 1220 de Cesari Ave
- 400 California Ave
- 155 N Park Dr
- 149 N Park Dr
- 1213 de Cesari Ave
- 1209 de Cesari Ave
- 1217 de Cesari Ave
- 1224 de Cesari Ave
- 157 N Park Dr
- 1205 de Cesari Ave
- 1221 de Cesari Ave
- 1225 de Cesari Ave
- 1228 de Cesari Ave
- 1201 de Cesari Ave
- 401 California Ave
- 150 N Park Dr