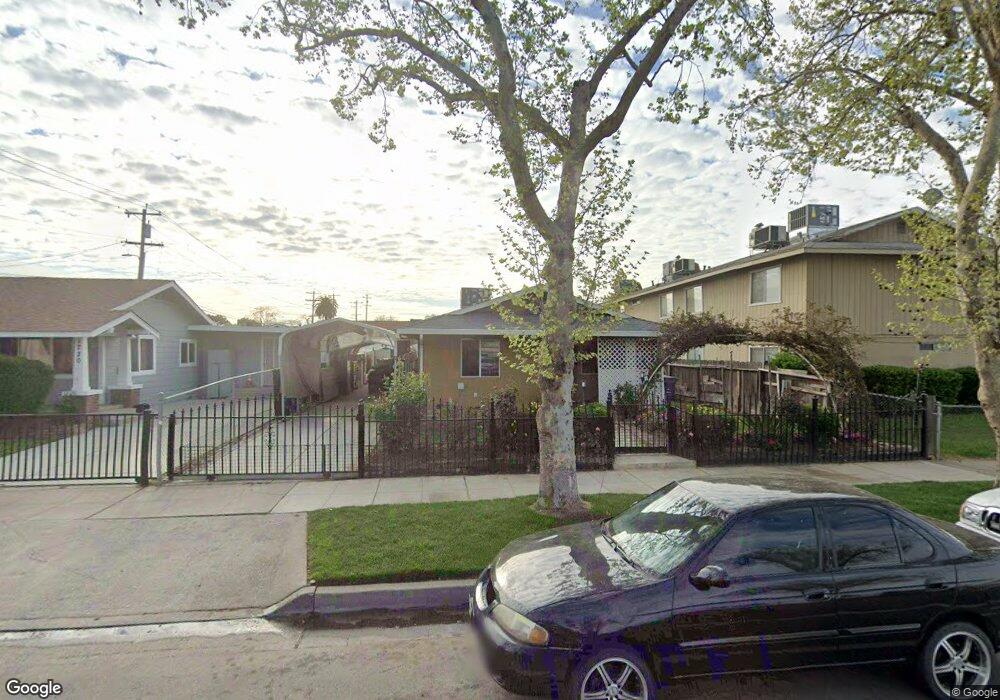
1212 M St Merced, CA 95341
South Merced NeighborhoodEstimated Value: $235,000 - $263,000
2
Beds
1
Bath
928
Sq Ft
$267/Sq Ft
Est. Value
About This Home
This home is located at 1212 M St, Merced, CA 95341 and is currently estimated at $248,011, approximately $267 per square foot. 1212 M St is a home located in Merced County with nearby schools including Don Stowell Elementary School, Tenaya Middle School, and Merced High School.
Ownership History
Date
Name
Owned For
Owner Type
Purchase Details
Closed on
Aug 27, 2010
Sold by
Gonzalez Vasquez Brenda and Gonzalez Mora Juan Manuel
Bought by
Mora Juan Manuel Gonzalez
Current Estimated Value
Purchase Details
Closed on
Jul 15, 2010
Sold by
Vasquez Brenda
Bought by
Gonzalez Vasquez Brenda and Gonzalez Mora Juan Manuel
Purchase Details
Closed on
Jul 13, 2010
Sold by
Federal National Mortgage Association
Bought by
Vasquez Brenda
Purchase Details
Closed on
Apr 13, 2010
Sold by
Ibara Jose Luis
Bought by
Federal National Mortgage Association
Purchase Details
Closed on
Feb 7, 1997
Sold by
Cabral Mary Josephine
Bought by
Ibarra Jose Luis
Home Financials for this Owner
Home Financials are based on the most recent Mortgage that was taken out on this home.
Original Mortgage
$50,000
Interest Rate
7.63%
Create a Home Valuation Report for This Property
The Home Valuation Report is an in-depth analysis detailing your home's value as well as a comparison with similar homes in the area
Home Values in the Area
Average Home Value in this Area
Purchase History
| Date | Buyer | Sale Price | Title Company |
|---|---|---|---|
| Mora Juan Manuel Gonzalez | -- | None Available | |
| Gonzalez Vasquez Brenda | -- | None Available | |
| Vasquez Brenda | $52,500 | Transcounty Title Company | |
| Federal National Mortgage Association | $185,279 | First American Title Ins Co | |
| Ibarra Jose Luis | $64,000 | Chicago Title Co |
Source: Public Records
Mortgage History
| Date | Status | Borrower | Loan Amount |
|---|---|---|---|
| Previous Owner | Ibarra Jose Luis | $50,000 |
Source: Public Records
Tax History
| Year | Tax Paid | Tax Assessment Tax Assessment Total Assessment is a certain percentage of the fair market value that is determined by local assessors to be the total taxable value of land and additions on the property. | Land | Improvement |
|---|---|---|---|---|
| 2025 | $725 | $66,608 | $10,244 | $56,364 |
| 2024 | $725 | $65,303 | $10,044 | $55,259 |
| 2023 | $715 | $64,024 | $9,848 | $54,176 |
| 2022 | $704 | $62,769 | $9,655 | $53,114 |
| 2021 | $703 | $61,539 | $9,466 | $52,073 |
| 2020 | $706 | $60,909 | $9,369 | $51,540 |
| 2019 | $696 | $59,716 | $9,186 | $50,530 |
| 2018 | $635 | $58,546 | $9,006 | $49,540 |
| 2017 | $658 | $57,399 | $8,830 | $48,569 |
| 2016 | $648 | $56,274 | $8,657 | $47,617 |
| 2015 | $638 | $55,429 | $8,527 | $46,902 |
| 2014 | $625 | $54,344 | $8,360 | $45,984 |
Source: Public Records
Map
Nearby Homes
- 1122 N St
- 1075 Martin Luther King Junior Way
- 0 Canal St
- 1250 I St
- 919 W 14th St
- 1616 Martin Luther King Junior Way
- 835 W 10th St
- 65 W 14th St
- 62 W 16th St
- 259 W 18th St
- 915 R St
- 1151 W 11th St
- 92 E 12th St
- 132 W 18th St
- 308 W 20th St
- 115 E 13th St
- 4 E Main St
- 902 W 20th St
- 1251 W 9th St
- 328 W 21st St
Your Personal Tour Guide
Ask me questions while you tour the home.