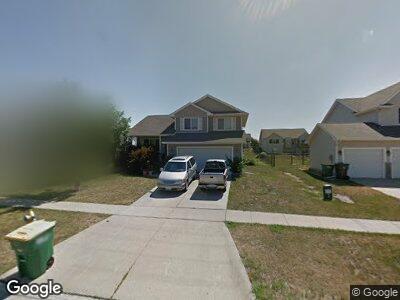
1212 S 3rd St Indianola, IA 50125
Estimated Value: $246,000 - $273,238
3
Beds
5
Baths
1,229
Sq Ft
$214/Sq Ft
Est. Value
About This Home
This home is located at 1212 S 3rd St, Indianola, IA 50125 and is currently estimated at $262,560, approximately $213 per square foot. 1212 S 3rd St is a home located in Warren County with nearby schools including Indianola High School.
Ownership History
Date
Name
Owned For
Owner Type
Purchase Details
Closed on
Jul 12, 2023
Sold by
Maydanyuk Peter and Maydanyuk Natialia
Bought by
Nochvay Karina
Current Estimated Value
Home Financials for this Owner
Home Financials are based on the most recent Mortgage that was taken out on this home.
Original Mortgage
$172,810
Outstanding Balance
$170,666
Interest Rate
6.79%
Mortgage Type
New Conventional
Purchase Details
Closed on
Apr 19, 2018
Sold by
Weeks Dean
Bought by
Maydanyuk Peter and Maydanyuk Natalia
Purchase Details
Closed on
Apr 26, 2006
Sold by
Millard Construction Inc
Bought by
Maydanyuk Peter and Maydanyuk Natialia
Home Financials for this Owner
Home Financials are based on the most recent Mortgage that was taken out on this home.
Original Mortgage
$172,800
Interest Rate
6.5%
Mortgage Type
Adjustable Rate Mortgage/ARM
Create a Home Valuation Report for This Property
The Home Valuation Report is an in-depth analysis detailing your home's value as well as a comparison with similar homes in the area
Home Values in the Area
Average Home Value in this Area
Purchase History
| Date | Buyer | Sale Price | Title Company |
|---|---|---|---|
| Nochvay Karina | $214,500 | None Listed On Document | |
| Maydanyuk Peter | $74,000 | None Available | |
| Maydanyuk Peter | $287,250 | None Available |
Source: Public Records
Mortgage History
| Date | Status | Borrower | Loan Amount |
|---|---|---|---|
| Open | Nochvay Karina | $172,810 | |
| Previous Owner | Maydanyuk Peter | $173,000 | |
| Previous Owner | Maydanyuk Peter | $172,800 | |
| Previous Owner | Millard Construction Company | $148,500 |
Source: Public Records
Tax History Compared to Growth
Tax History
| Year | Tax Paid | Tax Assessment Tax Assessment Total Assessment is a certain percentage of the fair market value that is determined by local assessors to be the total taxable value of land and additions on the property. | Land | Improvement |
|---|---|---|---|---|
| 2024 | $4,356 | $243,000 | $40,100 | $202,900 |
| 2023 | $4,420 | $243,000 | $40,100 | $202,900 |
| 2022 | $4,374 | $216,300 | $40,100 | $176,200 |
| 2021 | $4,364 | $216,300 | $40,100 | $176,200 |
| 2020 | $4,364 | $204,100 | $40,100 | $164,000 |
| 2019 | $3,958 | $204,100 | $40,100 | $164,000 |
| 2018 | $3,784 | $183,500 | $0 | $0 |
| 2017 | $3,544 | $183,500 | $0 | $0 |
| 2016 | $3,456 | $168,200 | $0 | $0 |
| 2015 | $3,456 | $168,200 | $0 | $0 |
| 2014 | $3,452 | $168,200 | $0 | $0 |
Source: Public Records
Map
Nearby Homes
- 100 W 8th Ave
- 409 W 17th Ave
- Lot 1 Warren Wonder Estates
- Lot 4 Warren Wonder Estates
- Lot 5 Warren Wonder Estates
- Lot 3 Warren Wonder Estates
- Lot 7 Warren Wonder Estates
- Lot 8 Warren Wonder Estates
- Lot 9 Warren Wonder Estates
- Lot 11 Warren Wonder Estates
- Lot 12 Warren Wonder Estates
- Lot 13 Warren Wonder Estates
- Lot 10 Warren Wonder Estates
- Lot 2 Warren Wonder Estates
- Lot 6 Warren Wonder Estates
- Lot 14 Warren Wonder Estates
- Lot 15 Warren Wonder Estates
- 511 S Howard St
- 310 S 3rd St
- 2&3-75-23 Marywood Lakes Add Plat 2 W Pt Lot 3 Dr