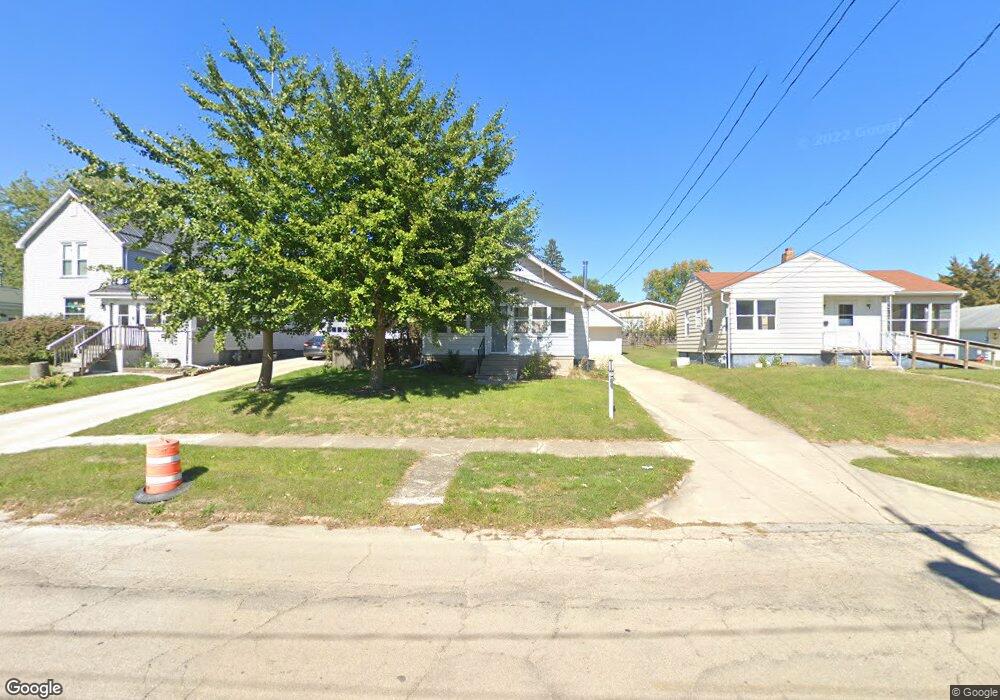
1212 W Prospect St Kewanee, IL 61443
Estimated Value: $67,000 - $106,000
2
Beds
--
Bath
1,024
Sq Ft
$78/Sq Ft
Est. Value
About This Home
This home is located at 1212 W Prospect St, Kewanee, IL 61443 and is currently estimated at $79,647, approximately $77 per square foot. 1212 W Prospect St is a home located in Henry County with nearby schools including Kewanee High School and Visitation Catholic School.
Ownership History
Date
Name
Owned For
Owner Type
Purchase Details
Closed on
Mar 27, 2021
Sold by
Estes Michael T
Bought by
Moraski John W
Current Estimated Value
Home Financials for this Owner
Home Financials are based on the most recent Mortgage that was taken out on this home.
Original Mortgage
$52,000
Outstanding Balance
$46,851
Interest Rate
2.87%
Mortgage Type
New Conventional
Estimated Equity
$32,796
Purchase Details
Closed on
May 31, 2019
Sold by
Lane Alexander and Lane Jeff
Bought by
Estes Michael T
Home Financials for this Owner
Home Financials are based on the most recent Mortgage that was taken out on this home.
Original Mortgage
$56,565
Interest Rate
4.62%
Mortgage Type
New Conventional
Purchase Details
Closed on
May 26, 2017
Sold by
Murphy Teddy L
Bought by
Lane Alexander and Lane Jeff
Home Financials for this Owner
Home Financials are based on the most recent Mortgage that was taken out on this home.
Original Mortgage
$34,000
Interest Rate
4.8%
Mortgage Type
Commercial
Create a Home Valuation Report for This Property
The Home Valuation Report is an in-depth analysis detailing your home's value as well as a comparison with similar homes in the area
Home Values in the Area
Average Home Value in this Area
Purchase History
| Date | Buyer | Sale Price | Title Company |
|---|---|---|---|
| Moraski John W | $58,000 | Attorney | |
| Estes Michael T | $56,000 | Attorney | |
| Lane Alexander | $42,500 | Western Illinois Title |
Source: Public Records
Mortgage History
| Date | Status | Borrower | Loan Amount |
|---|---|---|---|
| Open | Moraski John W | $52,000 | |
| Previous Owner | Estes Michael T | $56,565 | |
| Previous Owner | Lane Alexander | $34,000 |
Source: Public Records
Tax History
| Year | Tax Paid | Tax Assessment Tax Assessment Total Assessment is a certain percentage of the fair market value that is determined by local assessors to be the total taxable value of land and additions on the property. | Land | Improvement |
|---|---|---|---|---|
| 2024 | $1,958 | $24,142 | $1,257 | $22,885 |
| 2023 | $1,703 | $21,364 | $1,112 | $20,252 |
| 2022 | $1,513 | $19,440 | $1,012 | $18,428 |
| 2021 | $1,396 | $18,000 | $937 | $17,063 |
| 2020 | $1,048 | $14,968 | $916 | $14,052 |
| 2019 | $1,096 | $15,617 | $956 | $14,661 |
| 2018 | $1,149 | $16,002 | $980 | $15,022 |
| 2017 | $1,809 | $15,796 | $967 | $14,829 |
| 2016 | $1,825 | $15,956 | $977 | $14,979 |
| 2015 | $1,267 | $15,690 | $961 | $14,729 |
| 2013 | $1,267 | $16,090 | $986 | $15,104 |
Source: Public Records
Map
Nearby Homes
- 512 Commercial St
- 716 W 3rd St
- 702 Elliott St Unit 1
- 422 Ross St
- 215 W Prospect St
- 136 W Mill St
- 714 S Main St
- 732 S Main St
- 436 Hollis St
- 116 W Garfield St
- 328 E Prospect St
- 0 N Main St Unit E 2nd
- 712 Roosevelt Ave
- 522 E 5th St
- 202 Regina Ct
- 701 E 9th St
- 24508 County Highway 28
- 2283 E 2750th St
- 806 NE 3rd St
- 2769 Olof Krans Ave
- 1218 W Prospect St
- 1228 W Prospect St
- 1210 W Prospect St
- 1215 Roseview Ave
- 1213 Roseview Ave
- 1219 Roseview Ave
- 1206 W Prospect St
- 1232 W Prospect St
- 1221 Roseview Ave
- 1215 W Prospect St
- 1213 W Prospect St
- 1209 W Prospect St
- 1225 Roseview Ave
- 1205 Roseview Ave
- 1205 W Prospect St
- 1303 W Prospect St
- 409 S Washington St
- 1201 W Prospect St
- 1305 W Prospect St
- 1126 W Prospect St
Your Personal Tour Guide
Ask me questions while you tour the home.