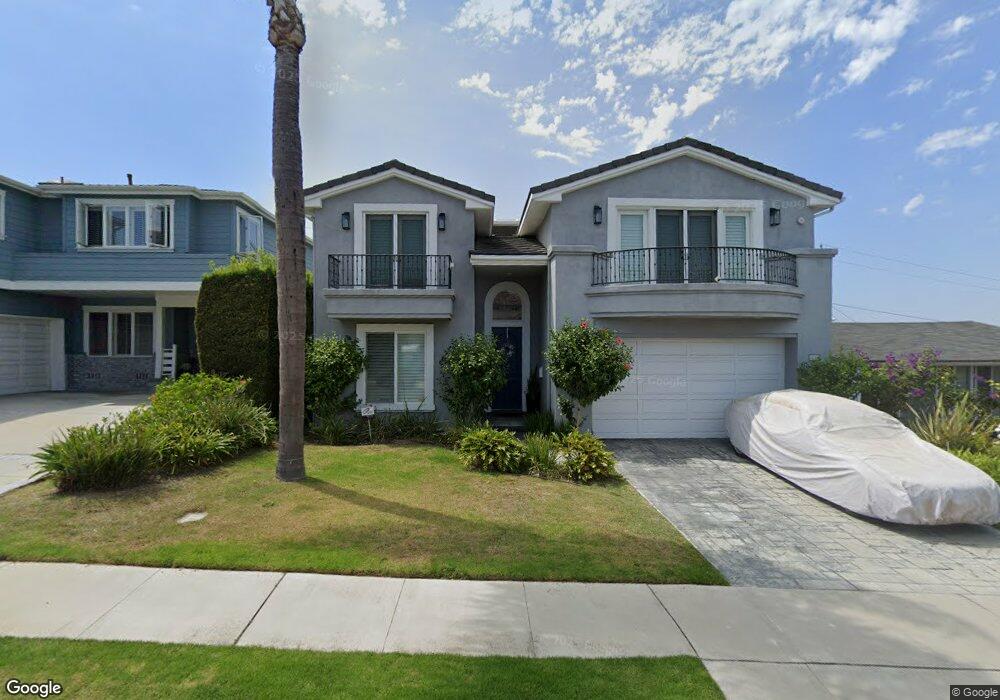
1213 Chestnut Ave Manhattan Beach, CA 90266
Estimated Value: $2,339,000 - $4,056,000
4
Beds
3
Baths
3,280
Sq Ft
$1,022/Sq Ft
Est. Value
About This Home
This home is located at 1213 Chestnut Ave, Manhattan Beach, CA 90266 and is currently estimated at $3,353,694, approximately $1,022 per square foot. 1213 Chestnut Ave is a home located in Los Angeles County with nearby schools including Meadows Avenue Elementary School, Manhattan Beach Middle School, and Mira Costa High School.
Ownership History
Date
Name
Owned For
Owner Type
Purchase Details
Closed on
Jul 31, 2014
Sold by
Reynolds Gregory J
Bought by
The Gregory J & Nancy D Reynolds Living
Current Estimated Value
Purchase Details
Closed on
Jan 23, 1998
Sold by
Sarwas Stephanie G
Bought by
Reynolds Gregory J and Reynolds Nancy D
Home Financials for this Owner
Home Financials are based on the most recent Mortgage that was taken out on this home.
Original Mortgage
$304,200
Interest Rate
7.02%
Purchase Details
Closed on
Jan 12, 1998
Sold by
Anderson Jimmie R
Bought by
Sarwas Stephanie Gray
Home Financials for this Owner
Home Financials are based on the most recent Mortgage that was taken out on this home.
Original Mortgage
$304,200
Interest Rate
7.02%
Create a Home Valuation Report for This Property
The Home Valuation Report is an in-depth analysis detailing your home's value as well as a comparison with similar homes in the area
Home Values in the Area
Average Home Value in this Area
Purchase History
We collect this data history from publicly available records. To have your information removed, we recommend requesting removal directly through your county’s website.
| Date | Buyer | Sale Price | Title Company |
|---|---|---|---|
| The Gregory J & Nancy D Reynolds Living | -- | None Available | |
| Reynolds Gregory J | $380,500 | Fidelity National Title Ins | |
| Sarwas Stephanie Gray | -- | Fidelity National Title Ins |
Source: Public Records
Mortgage History
We collect this data history from publicly available records. To have your information removed, we recommend requesting removal directly through your county’s website.
| Date | Status | Borrower | Loan Amount |
|---|---|---|---|
| Previous Owner | Reynolds Gregory J | $304,200 | |
| Closed | Reynolds Gregory J | $38,000 |
Source: Public Records
Tax History
| Year | Tax Paid | Tax Assessment Tax Assessment Total Assessment is a certain percentage of the fair market value that is determined by local assessors to be the total taxable value of land and additions on the property. | Land | Improvement |
|---|---|---|---|---|
| 2025 | $14,334 | $1,215,711 | $607,077 | $608,634 |
| 2024 | $14,122 | $1,191,874 | $595,174 | $596,700 |
| 2023 | $13,685 | $1,168,504 | $583,504 | $585,000 |
| 2022 | $13,453 | $1,145,593 | $572,063 | $573,530 |
| 2021 | $13,241 | $1,123,132 | $560,847 | $562,285 |
| 2019 | $12,893 | $1,089,821 | $544,213 | $545,608 |
| 2018 | $12,595 | $1,068,453 | $533,543 | $534,910 |
| 2016 | $11,602 | $1,026,966 | $512,826 | $514,140 |
| 2015 | $11,365 | $1,011,541 | $505,123 | $506,418 |
| 2014 | $11,212 | $991,727 | $495,229 | $496,498 |
Source: Public Records
Map
Nearby Homes
- 1300 12th St Unit E
- 1305 11th St
- 926 N Rowell Ave
- 1450 Manhattan Beach Blvd
- 1456 Manhattan Beach Blvd Unit C
- 1801 Oak Ave
- 1901 Oak Ave
- 2114 The Strand
- 947 Manhattan Beach
- 2317 Elm Ave
- 919 N Herrin St
- 1625 18th St
- 2100 Palm Ave
- 1816 John St
- 28 Westport
- 500 N Poinsettia Ave
- 1901 John St
- 2504 Palm Ave
- 2101 Lynngrove Dr
- 744 10th St
- 1209 Chestnut Ave
- 1217 Chestnut Ave
- 1212 Magnolia Ave
- 1205 Chestnut Ave
- 1208 Magnolia Ave
- 1216 Magnolia Ave
- 1401 Chestnut Ave
- 1204 Magnolia Ave
- 1212 Chestnut Ave
- 1208 Chestnut Ave
- 1216 Chestnut Ave
- 1400 Magnolia Ave
- 1201 Chestnut Ave
- 1405 Chestnut Ave
- 1204 Chestnut Ave
- 1200 Magnolia Ave
- 1400 Chestnut Ave
- 1404 Magnolia Ave
- 1167 Chestnut Ave
- 1200 Chestnut Ave
Your Personal Tour Guide
Ask me questions while you tour the home.