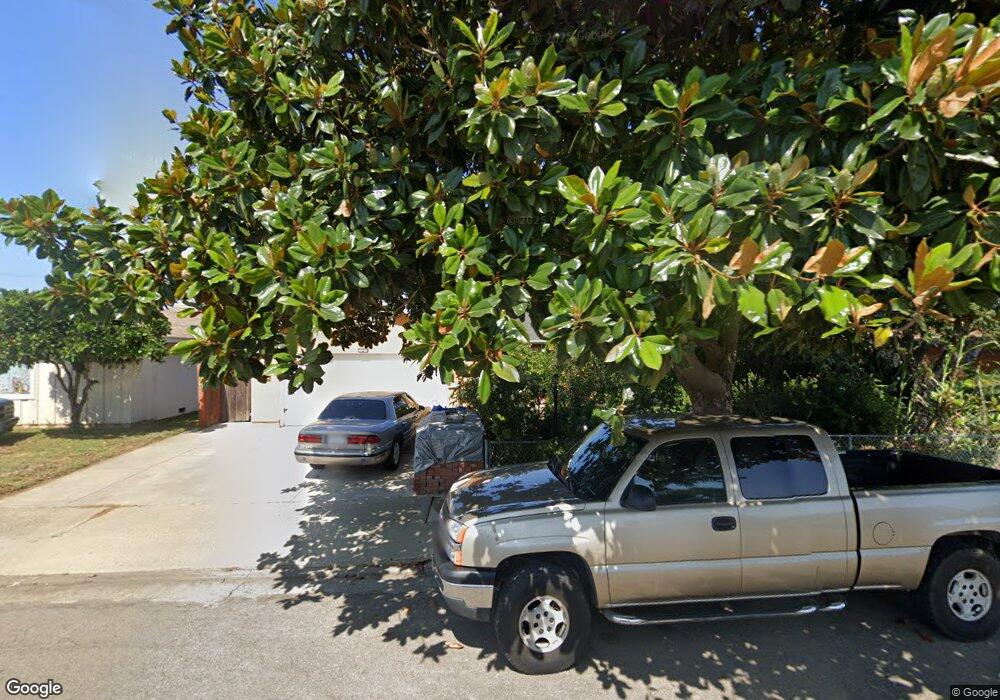
1213 E Lemon Ave Lompoc, CA 93436
Estimated Value: $496,000 - $569,000
3
Beds
2
Baths
1,286
Sq Ft
$413/Sq Ft
Est. Value
About This Home
This home is located at 1213 E Lemon Ave, Lompoc, CA 93436 and is currently estimated at $531,130, approximately $413 per square foot. 1213 E Lemon Ave is a home located in Santa Barbara County with nearby schools including Leonora Fillmore Elementary School, Lompoc Valley Middle School, and Lompoc High School.
Ownership History
Date
Name
Owned For
Owner Type
Purchase Details
Closed on
Jan 23, 2023
Sold by
Villareal Jorge E
Bought by
Higuera Jorge E and Higuera Eduviges
Current Estimated Value
Purchase Details
Closed on
Feb 3, 2010
Sold by
Borges George J and Borges Angelique M
Bought by
Higuera Jorge E and Higuera Eduviges
Home Financials for this Owner
Home Financials are based on the most recent Mortgage that was taken out on this home.
Original Mortgage
$179,685
Interest Rate
5.25%
Mortgage Type
FHA
Purchase Details
Closed on
Aug 19, 2003
Sold by
Kistle Patricia A
Bought by
Borges George J and Borges Angelique M
Home Financials for this Owner
Home Financials are based on the most recent Mortgage that was taken out on this home.
Original Mortgage
$255,983
Interest Rate
6.22%
Mortgage Type
FHA
Purchase Details
Closed on
Oct 18, 1995
Sold by
Kistle Patricia A
Bought by
Kistle Patricia A
Create a Home Valuation Report for This Property
The Home Valuation Report is an in-depth analysis detailing your home's value as well as a comparison with similar homes in the area
Home Values in the Area
Average Home Value in this Area
Purchase History
| Date | Buyer | Sale Price | Title Company |
|---|---|---|---|
| Higuera Jorge E | -- | None Listed On Document | |
| Higuera Jorge E | $183,000 | Chicago Title Company | |
| Borges George J | $260,000 | Chicago Title Company | |
| Kistle Patricia A | -- | -- |
Source: Public Records
Mortgage History
| Date | Status | Borrower | Loan Amount |
|---|---|---|---|
| Previous Owner | Higuera Jorge E | $179,685 | |
| Previous Owner | Borges George J | $255,983 | |
| Closed | Borges George J | $7,800 |
Source: Public Records
Tax History
| Year | Tax Paid | Tax Assessment Tax Assessment Total Assessment is a certain percentage of the fair market value that is determined by local assessors to be the total taxable value of land and additions on the property. | Land | Improvement |
|---|---|---|---|---|
| 2025 | $2,521 | $236,207 | $103,260 | $132,947 |
| 2023 | $2,521 | $227,037 | $99,251 | $127,786 |
| 2022 | $2,473 | $222,586 | $97,305 | $125,281 |
| 2021 | $2,498 | $218,223 | $95,398 | $122,825 |
| 2020 | $2,471 | $215,986 | $94,420 | $121,566 |
| 2019 | $2,429 | $211,752 | $92,569 | $119,183 |
| 2018 | $2,389 | $207,601 | $90,754 | $116,847 |
| 2017 | $2,344 | $203,531 | $88,975 | $114,556 |
| 2016 | $2,300 | $199,541 | $87,231 | $112,310 |
| 2014 | $2,249 | $192,695 | $84,238 | $108,457 |
Source: Public Records
Map
Nearby Homes
- 1100 N Third St
- 1127 Bell Ave
- 1121 Bell Ave
- 601 N Seventh St
- 701 E Pine Ave Unit 182
- 701 E Pine Ave Unit 176
- 701 E Pine Ave Unit 171
- 701 E Pine Ave Unit 161
- 1704 E Nectarine Ave
- 516 N 2nd St
- 610 E Pine Ave Unit 10
- 610 E Pine Ave Unit 29
- 610 E Pine Ave Unit 62
- 505 N 1st St
- 1735 River Vista Way
- 321 N Third St
- 1725 Autumn Sage Place
- 1741 River Vista Way
- 1744 River Vista Way
- 1742 River Vista Way
Your Personal Tour Guide
Ask me questions while you tour the home.