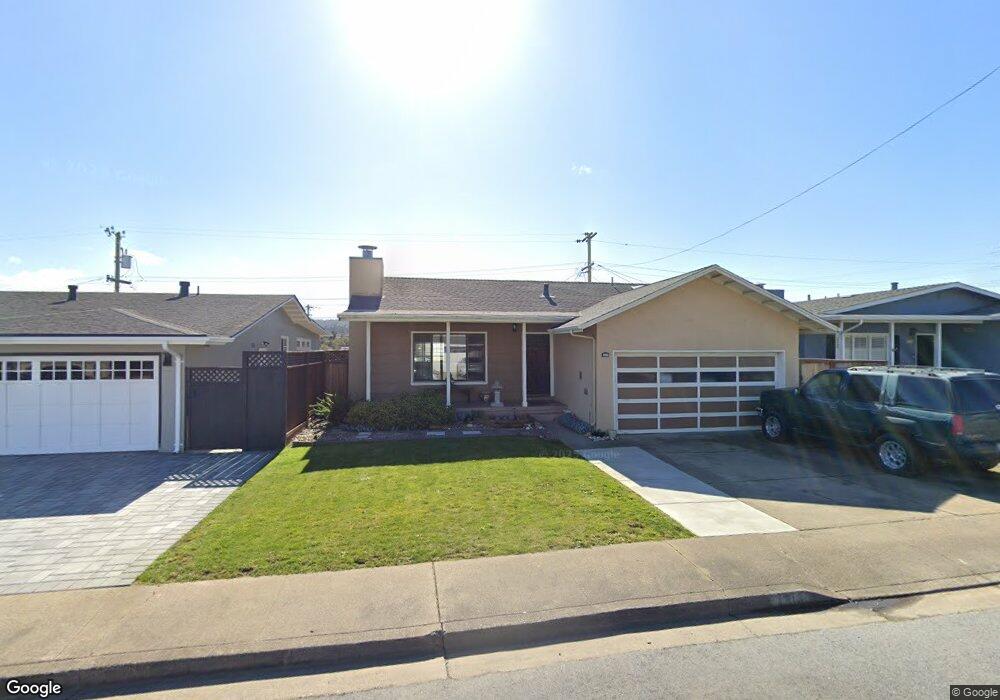
1213 Edgewood Way South San Francisco, CA 94080
Sunshine Gardens NeighborhoodEstimated Value: $959,000 - $1,244,000
3
Beds
2
Baths
1,050
Sq Ft
$1,098/Sq Ft
Est. Value
About This Home
This home is located at 1213 Edgewood Way, South San Francisco, CA 94080 and is currently estimated at $1,153,077, approximately $1,098 per square foot. 1213 Edgewood Way is a home located in San Mateo County with nearby schools including Sunshine Gardens Elementary School, Parkway Heights Middle School, and El Camino High School.
Ownership History
Date
Name
Owned For
Owner Type
Purchase Details
Closed on
Feb 16, 2001
Sold by
Leveroni Vincent M and Leveroni Pauline J
Bought by
Leveroni Vincent M and Leveroni Pauline
Current Estimated Value
Purchase Details
Closed on
Apr 20, 1999
Sold by
Betty Chin
Bought by
Leveroni Vincent M and Leveroni Pauline J
Home Financials for this Owner
Home Financials are based on the most recent Mortgage that was taken out on this home.
Original Mortgage
$227,500
Outstanding Balance
$45,017
Interest Rate
4.35%
Estimated Equity
$1,108,060
Purchase Details
Closed on
Apr 19, 1999
Sold by
Chin George N S and Chin Kim K
Bought by
Chin Betty
Home Financials for this Owner
Home Financials are based on the most recent Mortgage that was taken out on this home.
Original Mortgage
$227,500
Outstanding Balance
$45,017
Interest Rate
4.35%
Estimated Equity
$1,108,060
Create a Home Valuation Report for This Property
The Home Valuation Report is an in-depth analysis detailing your home's value as well as a comparison with similar homes in the area
Home Values in the Area
Average Home Value in this Area
Purchase History
| Date | Buyer | Sale Price | Title Company |
|---|---|---|---|
| Leveroni Vincent M | -- | -- | |
| Leveroni Vincent M | $325,000 | North American Title Insuran | |
| Chin Betty | -- | North American Title Insuran |
Source: Public Records
Mortgage History
| Date | Status | Borrower | Loan Amount |
|---|---|---|---|
| Open | Leveroni Vincent M | $227,500 |
Source: Public Records
Tax History Compared to Growth
Tax History
| Year | Tax Paid | Tax Assessment Tax Assessment Total Assessment is a certain percentage of the fair market value that is determined by local assessors to be the total taxable value of land and additions on the property. | Land | Improvement |
|---|---|---|---|---|
| 2025 | $6,300 | $509,484 | $254,742 | $254,742 |
| 2023 | $6,300 | $489,702 | $244,851 | $244,851 |
| 2022 | $5,857 | $480,100 | $240,050 | $240,050 |
| 2021 | $5,779 | $470,688 | $235,344 | $235,344 |
| 2020 | $5,707 | $465,862 | $232,931 | $232,931 |
| 2019 | $5,648 | $456,728 | $228,364 | $228,364 |
| 2018 | $5,516 | $447,774 | $223,887 | $223,887 |
| 2017 | $5,364 | $438,996 | $219,498 | $219,498 |
| 2016 | $5,232 | $430,390 | $215,195 | $215,195 |
| 2015 | $5,147 | $423,926 | $211,963 | $211,963 |
| 2014 | $5,034 | $415,622 | $207,811 | $207,811 |
Source: Public Records
Map
Nearby Homes
- 252 Sequoia Ave
- 1488 El Camino Real Unit 211
- 889 Mclellan Dr Unit 205
- 889 Mclellan Dr Unit 302
- 250 Willow Ave Unit 421
- 467 Holly Ave
- 0 Indio Dr
- 1700 El Camino Real Unit 2-03
- 1700 El Camino Real Unit 17-7
- 1700 El Camino Real
- 829 Stonegate Dr
- 556 Keoncrest Dr
- 706 Serra Dr
- 1 Elkwood Dr
- 3 Bradford Dr
- 91 Crown Cir
- 728 Cottonwood Ave
- 34 Arlington Dr
- 719 Circle Ct
- 58 Arlington Dr
- 1219 Edgewood Way
- 1207 Edgewood Way
- 1225 Edgewood Way
- 1212 Mission Rd
- 1201 Edgewood Way
- 1218 Mission Rd
- 1206 Mission Rd
- 1224 Mission Rd
- 1231 Edgewood Way
- 1212 Edgewood Way
- 1200 Mission Rd
- 1206 Edgewood Way
- 1218 Edgewood Way
- 1230 Mission Rd
- 1200 Edgewood Way
- 1224 Edgewood Way
- 1237 Edgewood Way
- 1230 Edgewood Way
- 1236 Mission Rd
- 1243 Edgewood Way