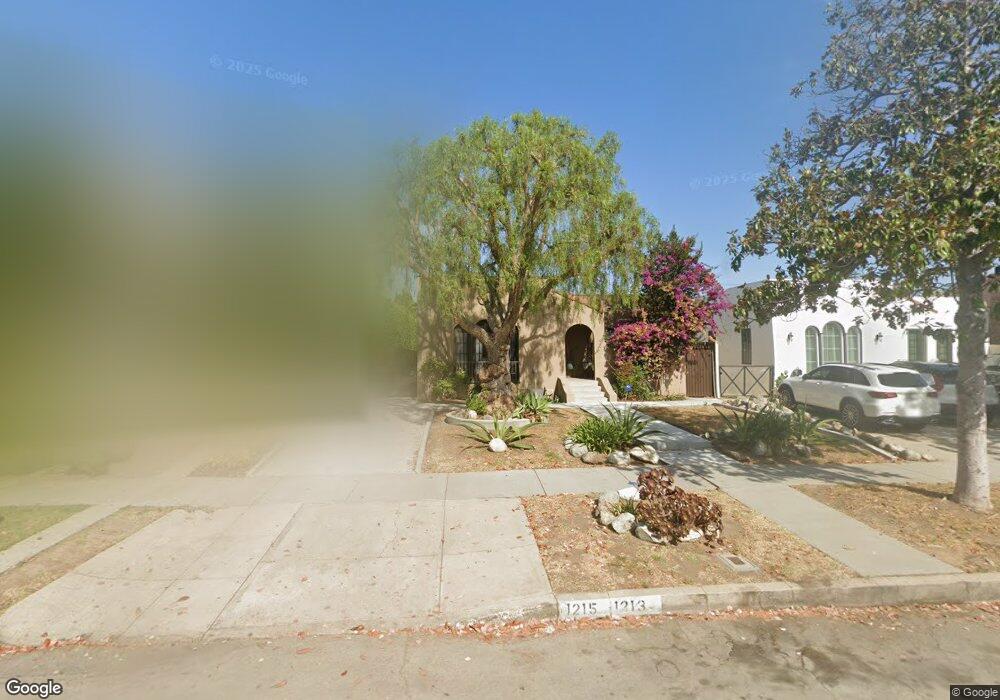
1213 S Hudson Ave Los Angeles, CA 90019
Miracle Mile NeighborhoodEstimated Value: $1,190,000 - $1,849,000
2
Beds
2
Baths
1,953
Sq Ft
$757/Sq Ft
Est. Value
About This Home
This home is located at 1213 S Hudson Ave, Los Angeles, CA 90019 and is currently estimated at $1,478,267, approximately $756 per square foot. 1213 S Hudson Ave is a home located in Los Angeles County with nearby schools including Wilshire Crest Elementary School, John Burroughs Middle School, and Los Angeles Senior High School.
Ownership History
Date
Name
Owned For
Owner Type
Purchase Details
Closed on
Jul 20, 2021
Sold by
Davis Kelli M
Bought by
Kmd Family Trust and Davis
Current Estimated Value
Home Financials for this Owner
Home Financials are based on the most recent Mortgage that was taken out on this home.
Original Mortgage
$943,000
Outstanding Balance
$856,018
Interest Rate
2.93%
Mortgage Type
New Conventional
Estimated Equity
$622,249
Purchase Details
Closed on
Jul 6, 2006
Sold by
Davis Kelli M
Bought by
Kmd Family Trust
Purchase Details
Closed on
Apr 18, 2003
Sold by
Baker Bobby and Estate Of Shirley Ann Baker
Bought by
Davis Kelli M
Home Financials for this Owner
Home Financials are based on the most recent Mortgage that was taken out on this home.
Original Mortgage
$313,500
Interest Rate
6.65%
Mortgage Type
Purchase Money Mortgage
Create a Home Valuation Report for This Property
The Home Valuation Report is an in-depth analysis detailing your home's value as well as a comparison with similar homes in the area
Home Values in the Area
Average Home Value in this Area
Purchase History
| Date | Buyer | Sale Price | Title Company |
|---|---|---|---|
| Kmd Family Trust | -- | Accommodation/Courtesy Recordi | |
| Davis Kelli M | -- | Ticor Title | |
| Kmd Family Trust | -- | Accommodation | |
| Davis Kelli M | $330,000 | Stewart Title Of California |
Source: Public Records
Mortgage History
| Date | Status | Borrower | Loan Amount |
|---|---|---|---|
| Open | Davis Kelli M | $943,000 | |
| Previous Owner | Davis Kelli M | $313,500 |
Source: Public Records
Tax History Compared to Growth
Tax History
| Year | Tax Paid | Tax Assessment Tax Assessment Total Assessment is a certain percentage of the fair market value that is determined by local assessors to be the total taxable value of land and additions on the property. | Land | Improvement |
|---|---|---|---|---|
| 2025 | $8,445 | $692,689 | $289,656 | $403,033 |
| 2024 | $8,445 | $679,108 | $283,977 | $395,131 |
| 2023 | $8,287 | $665,793 | $278,409 | $387,384 |
| 2022 | $7,911 | $652,739 | $272,950 | $379,789 |
| 2021 | $7,805 | $639,942 | $267,599 | $372,343 |
| 2020 | $7,888 | $633,382 | $264,856 | $368,526 |
| 2019 | $7,580 | $620,963 | $259,663 | $361,300 |
| 2018 | $7,454 | $608,788 | $254,572 | $354,216 |
| 2016 | $7,118 | $585,150 | $244,688 | $340,462 |
| 2015 | $7,015 | $576,361 | $241,013 | $335,348 |
| 2014 | $7,047 | $565,071 | $236,292 | $328,779 |
Source: Public Records
Map
Nearby Homes
- 1245 S Hudson Ave
- 1307 S Rimpau Blvd
- 1216 S Mullen Ave
- 1214 S Tremaine Ave
- 1241 S Muirfield Rd
- 1281 S Mullen Ave
- 1240 S Muirfield Rd
- 4506 Dockweiler St Unit 203
- 4506 Dockweiler St Unit 503
- 4912 Edgewood Place
- 1019 S Rimpau Blvd
- 1100 S Highland Ave
- 1200 S Citrus Ave
- 956 S Longwood Ave
- 1086 West Blvd
- 950 S Longwood Ave
- 1036 S Citrus Ave
- 4669 W Olympic Blvd
- 928 S Tremaine Ave
- 5112 Edgewood Place
- 1209 S Hudson Ave
- 1219 S Hudson Ave
- 1211 S Hudson Ave
- 1223 S Hudson Ave
- 1201 S Hudson Ave
- 4758 W 12th St
- 4758 W 12th St Ave
- 4758 W 12th St St
- 1227 S Hudson Ave Unit 2
- 1227 S Hudson Ave
- 1229 S Hudson Ave
- 1206 Keniston Ave Unit 1208
- 1206 Keniston Ave
- 1212 Keniston Ave
- 4768 W 12th St
- 1208 Keniston Ave
- 1208 Keniston Ave Unit 1208
- 1203 S Hudson Ave
- 1216 Keniston Ave
- 1216 Keniston Ave Unit 1216 Keniston