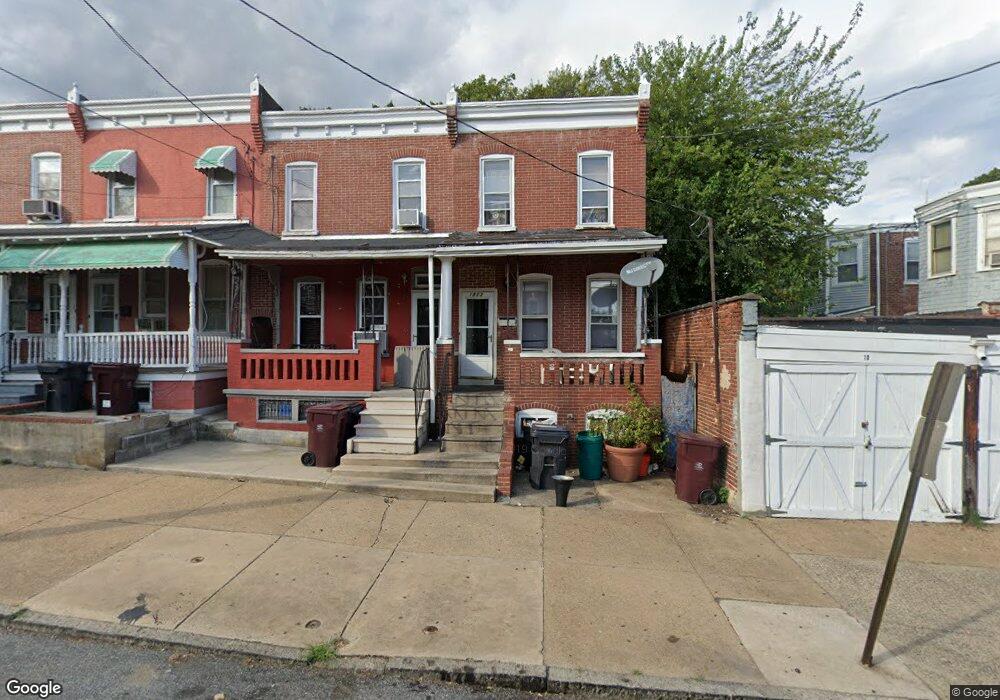
1213 W 5th St Wilmington, DE 19805
Estimated Value: $178,000 - $187,041
3
Beds
2
Baths
1,250
Sq Ft
$146/Sq Ft
Est. Value
About This Home
This home is located at 1213 W 5th St, Wilmington, DE 19805 and is currently estimated at $182,510, approximately $146 per square foot. 1213 W 5th St is a home located in New Castle County with nearby schools including Lewis (William C.) Dual Language Elementary School, Skyline Middle School, and Thomas McKean High School.
Ownership History
Date
Name
Owned For
Owner Type
Purchase Details
Closed on
Apr 24, 2023
Sold by
Stanford Kenneth
Bought by
Muflihi Keyaira
Current Estimated Value
Home Financials for this Owner
Home Financials are based on the most recent Mortgage that was taken out on this home.
Original Mortgage
$121,250
Outstanding Balance
$117,880
Interest Rate
6.6%
Mortgage Type
New Conventional
Estimated Equity
$64,630
Purchase Details
Closed on
Oct 28, 2011
Sold by
M & T Bank
Bought by
Stanford Kenneth
Purchase Details
Closed on
Jun 24, 2011
Sold by
Hooks Desiree
Bought by
Wilmington Trust Company
Purchase Details
Closed on
May 26, 2006
Sold by
Marconi Vittoria
Bought by
Hooks Desiree
Home Financials for this Owner
Home Financials are based on the most recent Mortgage that was taken out on this home.
Original Mortgage
$4,040
Interest Rate
6.62%
Mortgage Type
Stand Alone Second
Create a Home Valuation Report for This Property
The Home Valuation Report is an in-depth analysis detailing your home's value as well as a comparison with similar homes in the area
Home Values in the Area
Average Home Value in this Area
Purchase History
| Date | Buyer | Sale Price | Title Company |
|---|---|---|---|
| Muflihi Keyaira | -- | None Listed On Document | |
| Stanford Kenneth | $17,200 | Campus Title Company | |
| Wilmington Trust Company | $20,000 | None Available | |
| Hooks Desiree | $104,900 | None Available |
Source: Public Records
Mortgage History
| Date | Status | Borrower | Loan Amount |
|---|---|---|---|
| Open | Muflihi Keyaira | $121,250 | |
| Previous Owner | Hooks Desiree | $4,040 | |
| Previous Owner | Hooks Desiree | $104,900 |
Source: Public Records
Tax History Compared to Growth
Tax History
| Year | Tax Paid | Tax Assessment Tax Assessment Total Assessment is a certain percentage of the fair market value that is determined by local assessors to be the total taxable value of land and additions on the property. | Land | Improvement |
|---|---|---|---|---|
| 2024 | $496 | $15,900 | $3,500 | $12,400 |
| 2023 | $431 | $15,900 | $3,500 | $12,400 |
| 2022 | $433 | $15,900 | $3,500 | $12,400 |
| 2021 | $432 | $15,900 | $3,500 | $12,400 |
| 2020 | $435 | $15,900 | $3,500 | $12,400 |
| 2019 | $317 | $15,900 | $3,500 | $12,400 |
| 2018 | $433 | $15,900 | $3,500 | $12,400 |
| 2017 | $432 | $15,900 | $3,500 | $12,400 |
| 2016 | $410 | $15,900 | $3,500 | $12,400 |
| 2015 | $674 | $15,900 | $3,500 | $12,400 |
| 2014 | $640 | $15,900 | $3,500 | $12,400 |
Source: Public Records
Map
Nearby Homes
- 1215 W 5th St
- 1217 W 5th St
- 1219 W 5th St
- 507 N Harrison St
- 509 N Harrison St
- 1221 W 5th St
- 505 N Harrison St
- 513 N Harrison St
- 503 N Harrison St
- 1223 W 5th St
- 515 N Harrison St
- 517 N Harrison St
- 1225 W 5th St
- 1210 Mccoy Way
- 1212 Mccoy Way
- 519 N Harrison St
- 1214 Mccoy Way
- 1216 Mccoy Way
- 521 N Harrison St
- 508 N Franklin St