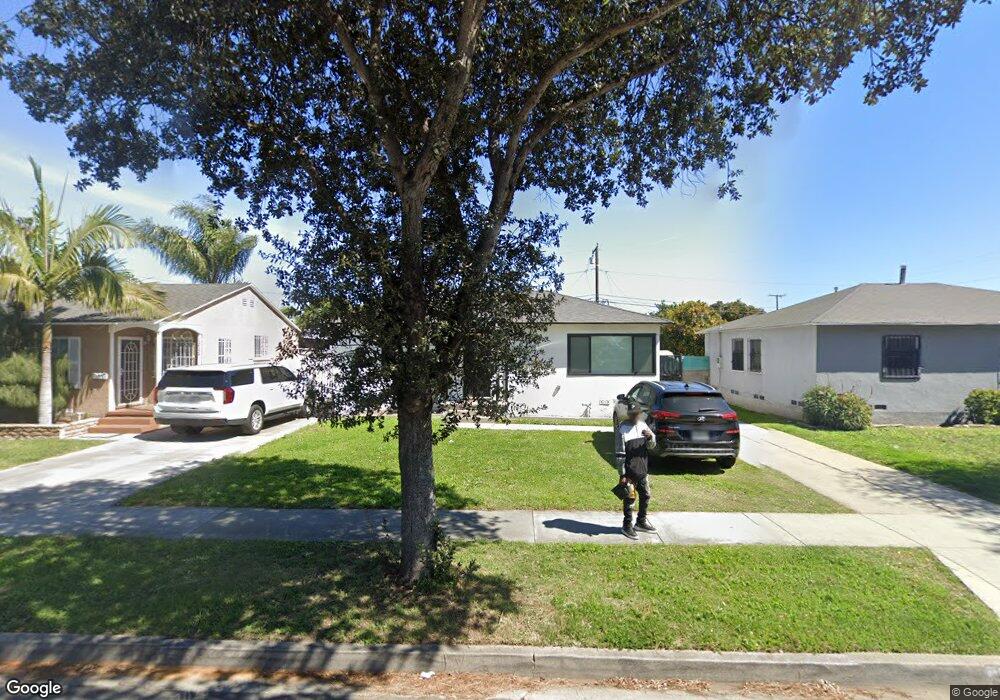
12138 S Central Ave Los Angeles, CA 90059
Estimated Value: $629,000 - $788,000
3
Beds
2
Baths
1,357
Sq Ft
$508/Sq Ft
Est. Value
About This Home
This home is located at 12138 S Central Ave, Los Angeles, CA 90059 and is currently estimated at $689,895, approximately $508 per square foot. 12138 S Central Ave is a home located in Los Angeles County with nearby schools including Carver Elementary School, Compton Early College, and Bunche Middle School.
Ownership History
Date
Name
Owned For
Owner Type
Purchase Details
Closed on
Aug 19, 2019
Sold by
Polee Regina E Williams and Polee Regina Williams
Bought by
Polee Salan L and Polee Shannon
Current Estimated Value
Home Financials for this Owner
Home Financials are based on the most recent Mortgage that was taken out on this home.
Original Mortgage
$342,000
Outstanding Balance
$300,142
Interest Rate
3.8%
Mortgage Type
New Conventional
Estimated Equity
$389,753
Purchase Details
Closed on
Mar 1, 2019
Sold by
Polee Reylan E William and Georges Polee Living Trust
Bought by
Rlt Tirnert Jasmine C and Rlt Regina Williams Polee
Purchase Details
Closed on
Jul 2, 2015
Sold by
Polee Georgell
Bought by
Polee Ii Georgell and George Polee Ii Living Trust
Purchase Details
Closed on
Mar 12, 2010
Sold by
Polee George L
Bought by
Polee George L and George L Polee Living Trust
Create a Home Valuation Report for This Property
The Home Valuation Report is an in-depth analysis detailing your home's value as well as a comparison with similar homes in the area
Home Values in the Area
Average Home Value in this Area
Purchase History
| Date | Buyer | Sale Price | Title Company |
|---|---|---|---|
| Polee Salan L | $380,000 | Lawyers Title | |
| Rlt Tirnert Jasmine C | -- | None Available | |
| Polee Ii Georgell | -- | None Available | |
| Polee George L | -- | None Available |
Source: Public Records
Mortgage History
| Date | Status | Borrower | Loan Amount |
|---|---|---|---|
| Open | Polee Salan L | $342,000 |
Source: Public Records
Tax History Compared to Growth
Tax History
| Year | Tax Paid | Tax Assessment Tax Assessment Total Assessment is a certain percentage of the fair market value that is determined by local assessors to be the total taxable value of land and additions on the property. | Land | Improvement |
|---|---|---|---|---|
| 2025 | $6,610 | $503,341 | $332,465 | $170,876 |
| 2024 | $6,610 | $493,473 | $325,947 | $167,526 |
| 2023 | $6,493 | $483,798 | $319,556 | $164,242 |
| 2022 | $5,113 | $391,613 | $313,291 | $78,322 |
| 2021 | $5,216 | $383,936 | $307,149 | $76,787 |
| 2019 | $989 | $28,516 | $13,596 | $14,920 |
| 2018 | $885 | $27,958 | $13,330 | $14,628 |
| 2016 | $837 | $26,874 | $12,813 | $14,061 |
| 2015 | $817 | $26,471 | $12,621 | $13,850 |
| 2014 | -- | $25,953 | $12,374 | $13,579 |
Source: Public Records
Map
Nearby Homes
- 12119 Alvaro St
- 1220 E 121st St
- 1223 E 124th St
- 1239 E 124th St
- 11912 Elva Ave
- 12623 S Slater Ave
- 11847 Alabama St
- 12233 Compton Ave
- 1563 E 119th St
- 12812 Clovis Ave
- 1950 N Bloom Dr
- 682 E 120th St
- 1571 E 118th St
- 12929 S Central Ave
- 11863 Stanford Ave
- 825 Sweetbay Ln
- 1726 E 122nd St
- 1727 E 123rd St
- 2117 N Keene Ave
- 11218 Belhaven Ave
- 12134 S Central Ave
- 12144 S Central Ave
- 12128 S Central Ave
- 12148 S Central Ave
- 12203 Alvaro St
- 12133 Alvaro St
- 12207 Alvaro St
- 12124 S Central Ave
- 12202 S Central Ave
- 12129 Alvaro St
- 12213 Alvaro St
- 12123 Alvaro St
- 12208 S Central Ave
- 12118 S Central Ave
- 12217 Alvaro St
- 12223 Alvaro St
- 12114 S Central Ave
- 12214 S Central Ave
- 0 Central Unit CC52653
- 0 Central Unit MB22217887