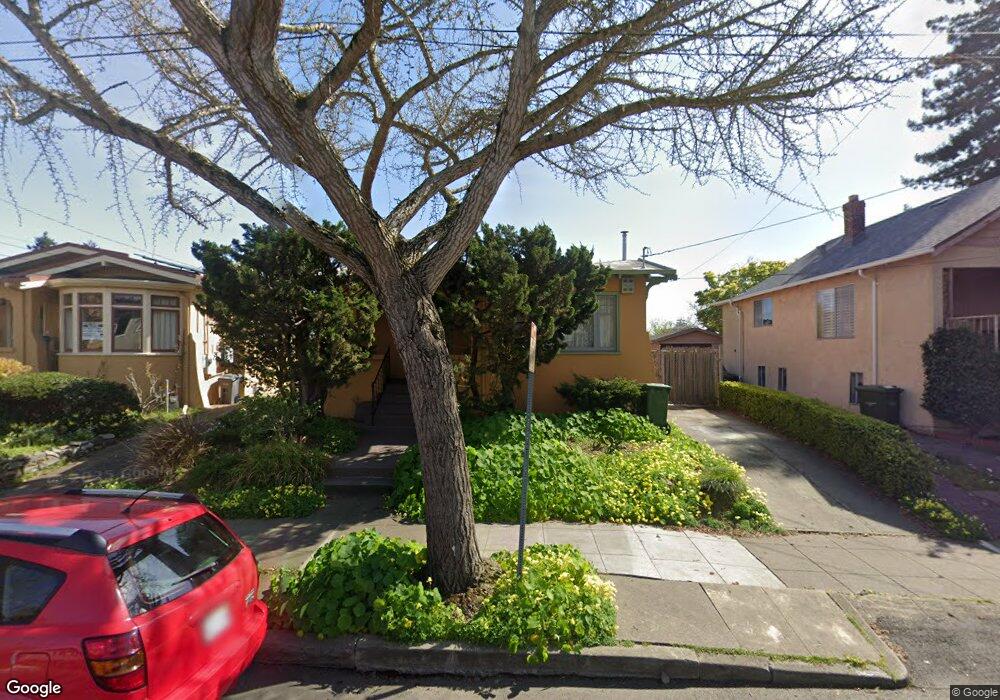
1214 Derby St Berkeley, CA 94702
West Berkeley NeighborhoodEstimated Value: $933,000 - $1,086,000
3
Beds
1
Bath
1,139
Sq Ft
$916/Sq Ft
Est. Value
About This Home
This home is located at 1214 Derby St, Berkeley, CA 94702 and is currently estimated at $1,043,561, approximately $916 per square foot. 1214 Derby St is a home located in Alameda County with nearby schools including Oxford Elementary School, Washington Elementary School, and Malcolm X Elementary School.
Ownership History
Date
Name
Owned For
Owner Type
Purchase Details
Closed on
Sep 16, 2009
Sold by
Bent Barbara M
Bought by
Bent Barbara M
Current Estimated Value
Home Financials for this Owner
Home Financials are based on the most recent Mortgage that was taken out on this home.
Original Mortgage
$36,000
Interest Rate
5.25%
Mortgage Type
New Conventional
Purchase Details
Closed on
Apr 3, 2009
Sold by
Bent Barbara M and Peter Teichner Living Trust
Bought by
Bent Barbara M
Purchase Details
Closed on
Nov 23, 2008
Sold by
Teichner Peter
Bought by
Teichner Peter and The Peter Teichner Living Trus
Create a Home Valuation Report for This Property
The Home Valuation Report is an in-depth analysis detailing your home's value as well as a comparison with similar homes in the area
Home Values in the Area
Average Home Value in this Area
Purchase History
| Date | Buyer | Sale Price | Title Company |
|---|---|---|---|
| Bent Barbara M | -- | Old Republic Title Company | |
| Bent Barbara M | -- | None Available | |
| Teichner Peter | -- | None Available |
Source: Public Records
Mortgage History
| Date | Status | Borrower | Loan Amount |
|---|---|---|---|
| Closed | Bent Barbara M | $36,000 |
Source: Public Records
Tax History
| Year | Tax Paid | Tax Assessment Tax Assessment Total Assessment is a certain percentage of the fair market value that is determined by local assessors to be the total taxable value of land and additions on the property. | Land | Improvement |
|---|---|---|---|---|
| 2025 | $4,089 | $136,831 | $106,458 | $37,373 |
| 2024 | $4,089 | $134,011 | $104,371 | $36,640 |
| 2023 | $3,977 | $138,246 | $102,324 | $35,922 |
| 2022 | $3,856 | $128,536 | $100,318 | $35,218 |
| 2021 | $3,829 | $125,878 | $98,351 | $34,527 |
| 2020 | $3,528 | $131,516 | $97,343 | $34,173 |
| 2019 | $3,281 | $128,937 | $95,434 | $33,503 |
| 2018 | $3,195 | $126,409 | $93,563 | $32,846 |
| 2017 | $3,048 | $123,931 | $91,729 | $32,202 |
| 2016 | $2,870 | $121,502 | $89,931 | $31,571 |
| 2015 | $2,818 | $119,677 | $88,580 | $31,097 |
| 2014 | $2,719 | $117,333 | $86,845 | $30,488 |
Source: Public Records
Map
Nearby Homes
- 2751 Wallace St
- 2747 San Pablo Ave Unit 507
- 1034 Grayson St
- 1010 Grayson St
- 1142 Dwight Way
- 1118 Dwight Way
- 1092 Dwight Way
- 1450 Ward St
- 2758 Sacramento St
- 2750 Sacramento St
- 2774 Sacramento St
- 2782 Sacramento St
- 2790 Sacramento St
- 1237 Ashby Ave
- 1515 Derby St
- 1314 Ashby Ave
- 2922 Stanton St
- 1530 Stuart St
- 1039 Channing Way
- 3032 Mabel St
Your Personal Tour Guide
Ask me questions while you tour the home.