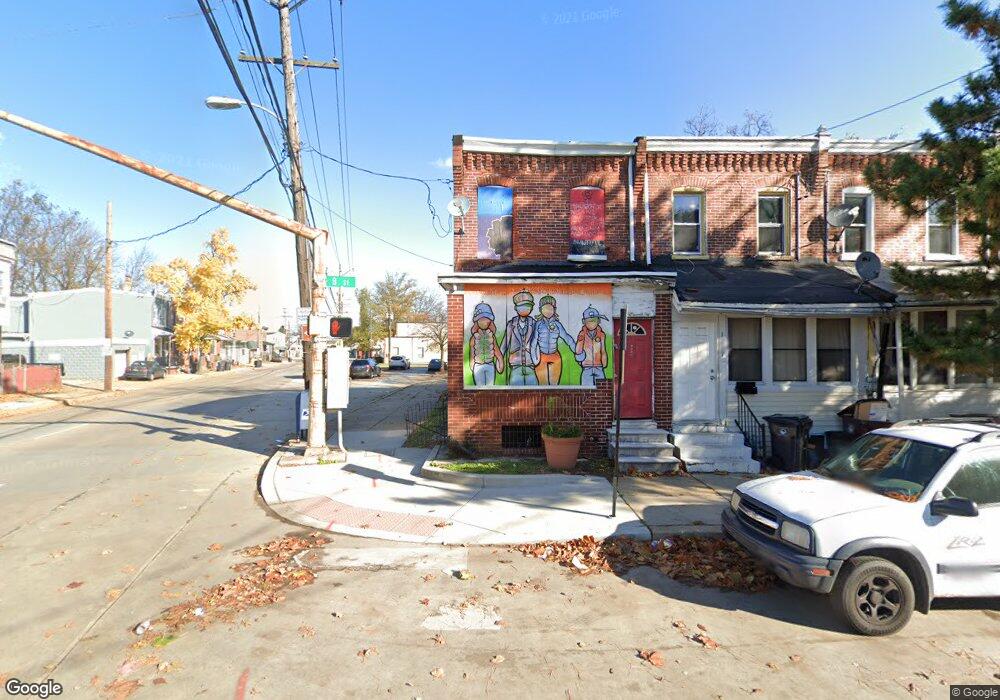
1215 B St Wilmington, DE 19801
South Wilmington NeighborhoodEstimated Value: $156,154 - $231,000
2
Beds
3
Baths
1,275
Sq Ft
$147/Sq Ft
Est. Value
About This Home
This home is located at 1215 B St, Wilmington, DE 19801 and is currently estimated at $187,289, approximately $146 per square foot. 1215 B St is a home located in New Castle County with nearby schools including The Bayard School, Newark High School, and First State Montessori Academy.
Ownership History
Date
Name
Owned For
Owner Type
Purchase Details
Closed on
Apr 2, 2021
Sold by
Wilmington Neighborhood Conservancy Land
Bought by
Buckley-Deni Barbara
Current Estimated Value
Purchase Details
Closed on
Nov 2, 2017
Sold by
City Of Wilmington
Bought by
The Wilmington Neighborhood Conservancy
Purchase Details
Closed on
May 27, 2009
Sold by
County Of New Castle
Bought by
City Of Wilmington
Purchase Details
Closed on
Mar 28, 2006
Sold by
Martin Kimekia and Martin Robert
Bought by
Washington Mutual Bank Fa
Purchase Details
Closed on
Dec 16, 2002
Sold by
Shallcross Mortgage Co
Bought by
Martin Kimekia E and Martin Robert
Home Financials for this Owner
Home Financials are based on the most recent Mortgage that was taken out on this home.
Original Mortgage
$47,025
Interest Rate
6.18%
Purchase Details
Closed on
Sep 5, 2002
Sold by
Rodriguez Maria Z
Bought by
Shallcross Mortgage Co
Create a Home Valuation Report for This Property
The Home Valuation Report is an in-depth analysis detailing your home's value as well as a comparison with similar homes in the area
Home Values in the Area
Average Home Value in this Area
Purchase History
| Date | Buyer | Sale Price | Title Company |
|---|---|---|---|
| Buckley-Deni Barbara | -- | Franta Richard E | |
| The Wilmington Neighborhood Conservancy | -- | None Available | |
| City Of Wilmington | $15,500 | None Available | |
| Washington Mutual Bank Fa | $61,165 | None Available | |
| Martin Kimekia E | $49,900 | -- | |
| Shallcross Mortgage Co | -- | -- |
Source: Public Records
Mortgage History
| Date | Status | Borrower | Loan Amount |
|---|---|---|---|
| Previous Owner | Martin Kimekia E | $47,025 |
Source: Public Records
Tax History Compared to Growth
Tax History
| Year | Tax Paid | Tax Assessment Tax Assessment Total Assessment is a certain percentage of the fair market value that is determined by local assessors to be the total taxable value of land and additions on the property. | Land | Improvement |
|---|---|---|---|---|
| 2024 | $741 | $20,100 | $1,700 | $18,400 |
| 2023 | $722 | $20,100 | $1,700 | $18,400 |
| 2022 | $715 | $20,100 | $1,700 | $18,400 |
| 2021 | $0 | $20,100 | $1,700 | $18,400 |
| 2020 | $0 | $20,100 | $1,700 | $18,400 |
| 2019 | $0 | $20,100 | $1,700 | $18,400 |
| 2018 | $0 | $20,100 | $1,700 | $18,400 |
| 2017 | -- | $20,100 | $1,700 | $18,400 |
| 2016 | -- | $20,100 | $1,700 | $18,400 |
| 2015 | -- | $20,100 | $1,700 | $18,400 |
| 2014 | -- | $20,100 | $1,700 | $18,400 |
Source: Public Records
Map
Nearby Homes
- 434 S Heald St
- 1117 B St
- 434 Queen St
- 428 S Claymont St
- 326 New Castle Ave
- 338 S Claymont St
- 308 Townsend St
- 306 Townsend St
- 304 Townsend St
- 609 S Heald St
- 318 S Claymont St
- 513 S Buttonwood St
- 310 S Claymont St
- 304 S Claymont St
- 1205 Lobdell St
- 731 A St
- 240 N Lombard St
- 511 E 3rd St
- 156 Christina Landing Dr
- 151 Christina Landing Dr