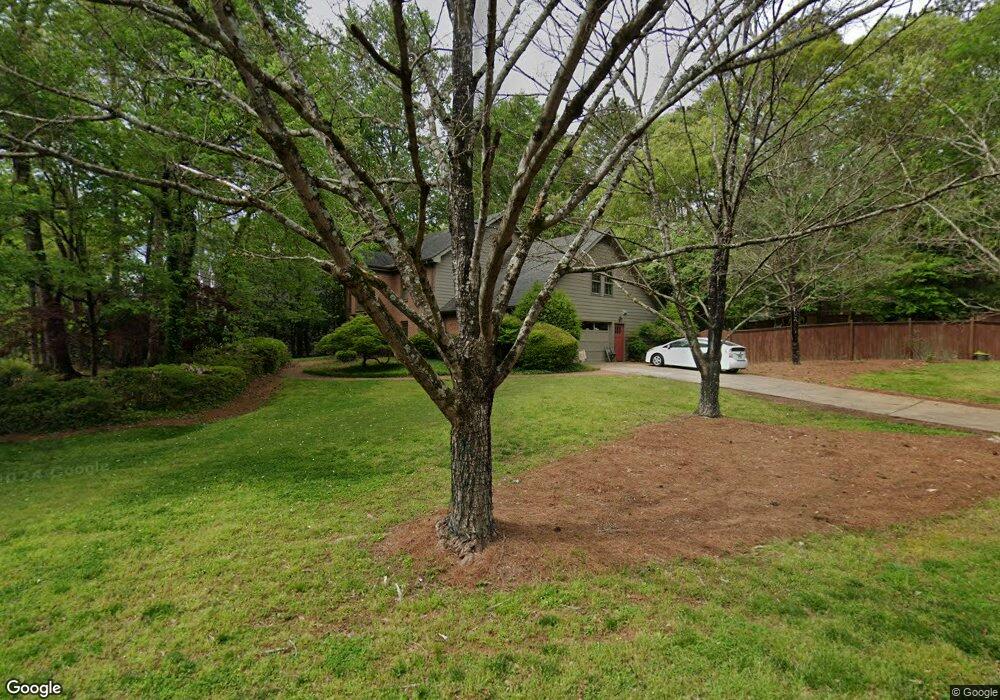
1215 Cliffpine Ct SW Marietta, GA 30064
Southwestern Marietta NeighborhoodEstimated Value: $604,000 - $730,000
4
Beds
3
Baths
3,475
Sq Ft
$193/Sq Ft
Est. Value
About This Home
This home is located at 1215 Cliffpine Ct SW, Marietta, GA 30064 and is currently estimated at $670,624, approximately $192 per square foot. 1215 Cliffpine Ct SW is a home located in Cobb County with nearby schools including A.L. Burruss Elementary School, Marietta Sixth Grade Academy, and Marietta Middle School.
Ownership History
Date
Name
Owned For
Owner Type
Purchase Details
Closed on
Jul 19, 2010
Sold by
Rambo Sharon P
Bought by
Eaker Kathryn and Eaker Rob
Current Estimated Value
Home Financials for this Owner
Home Financials are based on the most recent Mortgage that was taken out on this home.
Original Mortgage
$196,000
Outstanding Balance
$129,803
Interest Rate
4.73%
Mortgage Type
New Conventional
Estimated Equity
$540,821
Purchase Details
Closed on
Mar 10, 2010
Sold by
Plage Jane S
Bought by
Rambo Sharon P
Purchase Details
Closed on
Jul 29, 1994
Sold by
Clark Mary S
Bought by
Plage Jane S
Home Financials for this Owner
Home Financials are based on the most recent Mortgage that was taken out on this home.
Original Mortgage
$145,900
Interest Rate
8.39%
Create a Home Valuation Report for This Property
The Home Valuation Report is an in-depth analysis detailing your home's value as well as a comparison with similar homes in the area
Home Values in the Area
Average Home Value in this Area
Purchase History
| Date | Buyer | Sale Price | Title Company |
|---|---|---|---|
| Eaker Kathryn | $245,000 | -- | |
| Rambo Sharon P | $215,000 | -- | |
| Plage Jane S | $182,400 | -- |
Source: Public Records
Mortgage History
| Date | Status | Borrower | Loan Amount |
|---|---|---|---|
| Open | Eaker Kathryn | $196,000 | |
| Previous Owner | Plage Jane S | $145,900 |
Source: Public Records
Tax History Compared to Growth
Tax History
| Year | Tax Paid | Tax Assessment Tax Assessment Total Assessment is a certain percentage of the fair market value that is determined by local assessors to be the total taxable value of land and additions on the property. | Land | Improvement |
|---|---|---|---|---|
| 2025 | $643 | $229,576 | $56,000 | $173,576 |
| 2024 | $643 | $218,288 | $44,000 | $174,288 |
| 2023 | $490 | $218,288 | $44,000 | $174,288 |
| 2022 | $643 | $133,980 | $28,000 | $105,980 |
| 2021 | $660 | $133,980 | $28,000 | $105,980 |
| 2020 | $660 | $133,980 | $28,000 | $105,980 |
| 2019 | $659 | $124,912 | $24,000 | $100,912 |
| 2018 | $659 | $124,912 | $24,000 | $100,912 |
| 2017 | $530 | $124,912 | $24,000 | $100,912 |
| 2016 | $527 | $93,168 | $24,000 | $69,168 |
| 2015 | $576 | $93,168 | $24,000 | $69,168 |
| 2014 | $593 | $85,972 | $0 | $0 |
Source: Public Records
Map
Nearby Homes
- 1211 Cliffpine Ct SW
- 1198 Seminary Dr SW
- 1410 Dallas Cir SW
- 332 Rockmann Ln SW
- 560 Manning Rd SW
- 594 Manning Rd SW
- 1161 Rockmann Terrace SW
- 805 Manning Way SW
- 818 Manning Way SW Unit 1
- 1141 Whitlock Ave NW
- 1032 Chippendale Trail SW
- 1077 New Haven Dr SW Unit 12A
- 839 Manning Villas Ct SW
- 652 Trailwood Ln SW
- 1121 Cannongate Crossing SW
- 834 Cannon Run SW
- 1017 Cannongate Crossing SW
- 1011 Cannongate Crossing SW
- 1201 Cliffpine Ct SW
- 1220 Cliffpine Ct SW
- 387 Windsor Dr SW
- 1212 Cliffpine Ct SW
- 1216 Cliffpine Ct SW
- 1210 Cliffpine Ct SW
- 369 Windsor Dr SW
- 397 Windsor Dr SW
- 1230 Cliffpine Ct SW
- 1072 Chestnut Hill Cir SW
- 403 Windsor Dr SW Unit 1
- 403 Windsor Dr SW
- 1086 Chestnut Hill Cir SW
- 1231 Meadowmist Way SW
- 390 Windsor Dr SW
- 368 Windsor Dr SW Unit 10
- 368 Windsor Dr SW
- 1070 Chestnut Hill Cir SW
- 1073 Chestnut Hill Cir SW
- 415 Windsor Dr SW