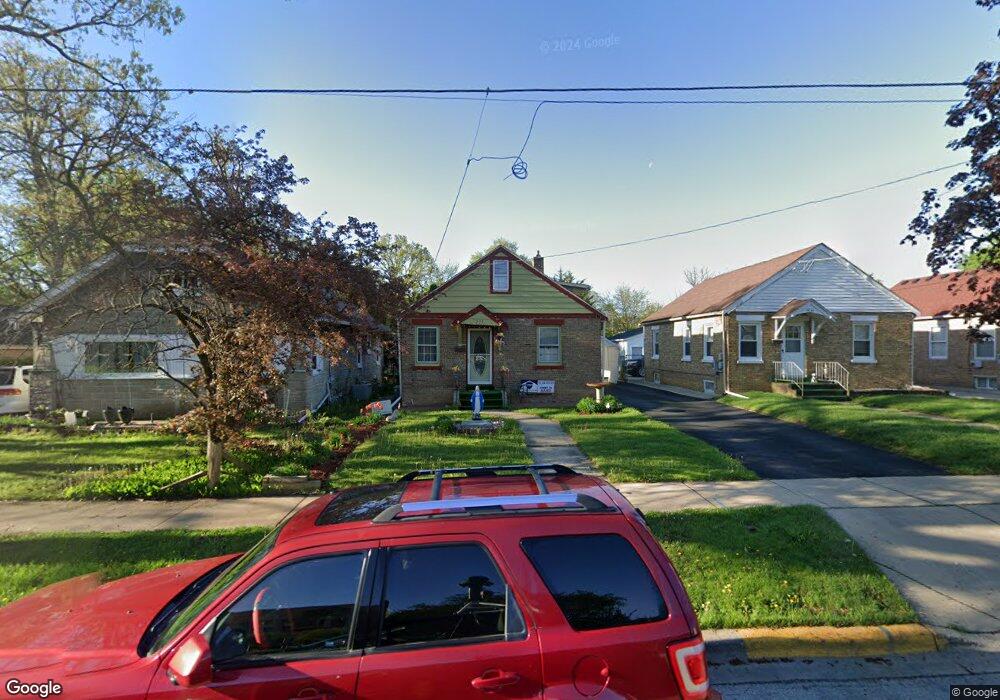
1215 Front St Aurora, IL 60505
Light of the Community NeighborhoodEstimated Value: $218,169 - $251,000
2
Beds
1
Bath
1,152
Sq Ft
$202/Sq Ft
Est. Value
About This Home
This home is located at 1215 Front St, Aurora, IL 60505 and is currently estimated at $233,042, approximately $202 per square foot. 1215 Front St is a home located in Kane County with nearby schools including Oak Park Elementary School, Henry W Cowherd Middle School, and East Aurora High School.
Ownership History
Date
Name
Owned For
Owner Type
Purchase Details
Closed on
Jan 15, 2018
Sold by
Campos Jose L
Bought by
Barraza Abelardo and Campos Claudia Veronica
Current Estimated Value
Purchase Details
Closed on
Jul 28, 2003
Sold by
Scott Zella
Bought by
Campos Jose L
Home Financials for this Owner
Home Financials are based on the most recent Mortgage that was taken out on this home.
Original Mortgage
$104,500
Outstanding Balance
$47,188
Interest Rate
5.97%
Mortgage Type
Purchase Money Mortgage
Estimated Equity
$185,854
Create a Home Valuation Report for This Property
The Home Valuation Report is an in-depth analysis detailing your home's value as well as a comparison with similar homes in the area
Home Values in the Area
Average Home Value in this Area
Purchase History
| Date | Buyer | Sale Price | Title Company |
|---|---|---|---|
| Barraza Abelardo | -- | Chicago Title Insurance Co | |
| Campos Jose L | $110,000 | Law Title Insurance Co Inc |
Source: Public Records
Mortgage History
| Date | Status | Borrower | Loan Amount |
|---|---|---|---|
| Open | Campos Jose L | $104,500 |
Source: Public Records
Tax History
| Year | Tax Paid | Tax Assessment Tax Assessment Total Assessment is a certain percentage of the fair market value that is determined by local assessors to be the total taxable value of land and additions on the property. | Land | Improvement |
|---|---|---|---|---|
| 2024 | $4,737 | $69,102 | $4,729 | $64,373 |
| 2023 | $4,486 | $60,030 | $4,225 | $55,805 |
| 2022 | $4,080 | $53,698 | $3,855 | $49,843 |
| 2021 | $4,036 | $49,993 | $3,589 | $46,404 |
| 2020 | $3,862 | $46,436 | $3,334 | $43,102 |
| 2019 | $4,253 | $48,270 | $3,089 | $45,181 |
| 2018 | $3,931 | $43,174 | $2,857 | $40,317 |
| 2017 | $3,658 | $37,302 | $2,632 | $34,670 |
| 2016 | $3,420 | $32,496 | $2,256 | $30,240 |
| 2015 | -- | $29,224 | $1,940 | $27,284 |
| 2014 | -- | $28,024 | $1,783 | $26,241 |
| 2013 | -- | $27,571 | $1,704 | $25,867 |
Source: Public Records
Map
Nearby Homes
- 202 N Loucks St
- 906 Grove St
- 913 Superior St
- 251 N Smith St
- 747 Delius St
- 131 N Kendall St
- 138 N Smith St
- 611 Pierce St
- 608 Front St
- 605 Grove St
- 1135 E Galena Blvd
- 953 Sheffer Rd
- 107 N State St
- 15 Hill Ave
- 907 Harley Ct
- 1900 E New York St
- 1671 Sheffer Rd
- 764 2nd Ave
- 1060 N Farnsworth Ave Unit 1105
- 0000 N Farnsworth Ave
Your Personal Tour Guide
Ask me questions while you tour the home.