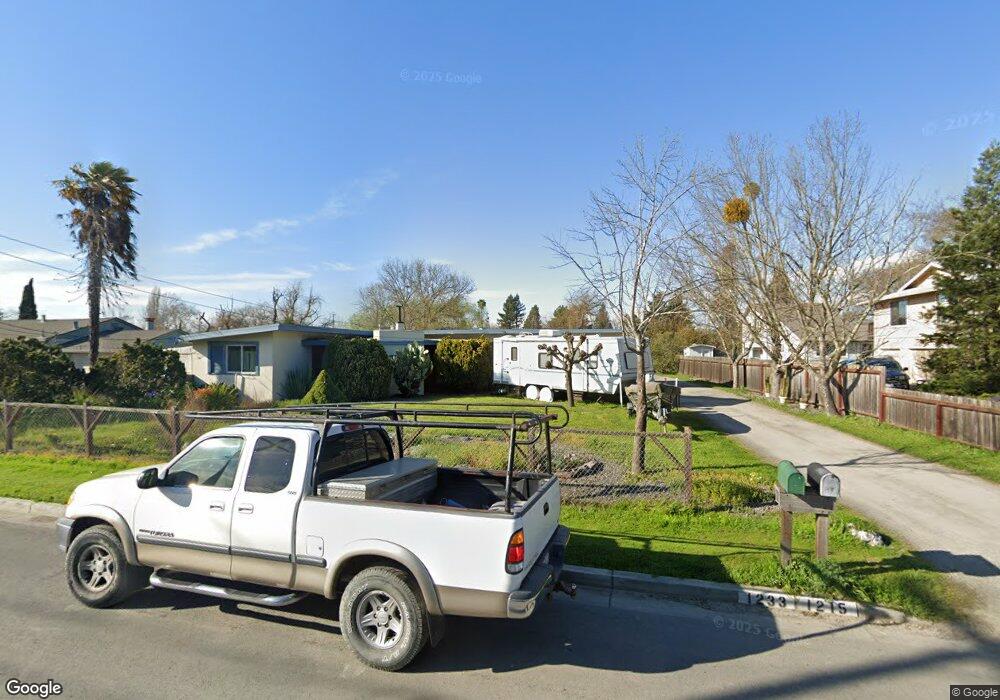
1215 Gloria Dr Santa Rosa, CA 95407
Estimated Value: $596,000 - $735,000
3
Beds
3
Baths
1,666
Sq Ft
$395/Sq Ft
Est. Value
About This Home
This home is located at 1215 Gloria Dr, Santa Rosa, CA 95407 and is currently estimated at $658,849, approximately $395 per square foot. 1215 Gloria Dr is a home located in Sonoma County with nearby schools including Elsie Allen High School and St. Michael's Orthodox School.
Ownership History
Date
Name
Owned For
Owner Type
Purchase Details
Closed on
May 14, 2018
Sold by
Cantarnies Patricio Moran and Moran Lorena N
Bought by
Cantarnies Patrico Moran and Moran Lorena N
Current Estimated Value
Home Financials for this Owner
Home Financials are based on the most recent Mortgage that was taken out on this home.
Original Mortgage
$400,000
Outstanding Balance
$344,413
Interest Rate
4.4%
Mortgage Type
New Conventional
Estimated Equity
$314,436
Purchase Details
Closed on
Feb 21, 2002
Sold by
Periman Nikki
Bought by
Moran Patricio and Moran Lorena
Home Financials for this Owner
Home Financials are based on the most recent Mortgage that was taken out on this home.
Original Mortgage
$220,000
Interest Rate
7.04%
Purchase Details
Closed on
Jul 16, 1999
Sold by
Warfield Rochelle
Bought by
Periman Nikki
Home Financials for this Owner
Home Financials are based on the most recent Mortgage that was taken out on this home.
Original Mortgage
$144,400
Interest Rate
7.51%
Create a Home Valuation Report for This Property
The Home Valuation Report is an in-depth analysis detailing your home's value as well as a comparison with similar homes in the area
Home Values in the Area
Average Home Value in this Area
Purchase History
| Date | Buyer | Sale Price | Title Company |
|---|---|---|---|
| Cantarnies Patrico Moran | $200,000 | North Coast Title Co | |
| Moran Patricio | $275,000 | Old Republic Title Company | |
| Periman Nikki | $180,500 | First American Title |
Source: Public Records
Mortgage History
| Date | Status | Borrower | Loan Amount |
|---|---|---|---|
| Open | Cantarnies Patrico Moran | $400,000 | |
| Previous Owner | Moran Patricio | $220,000 | |
| Previous Owner | Periman Nikki | $144,400 | |
| Closed | Moran Patricio | $41,250 |
Source: Public Records
Tax History Compared to Growth
Tax History
| Year | Tax Paid | Tax Assessment Tax Assessment Total Assessment is a certain percentage of the fair market value that is determined by local assessors to be the total taxable value of land and additions on the property. | Land | Improvement |
|---|---|---|---|---|
| 2025 | $6,213 | $443,025 | $147,723 | $295,302 |
| 2024 | $6,213 | $434,339 | $144,827 | $289,512 |
| 2023 | $6,213 | $425,824 | $141,988 | $283,836 |
| 2022 | $6,073 | $417,475 | $139,204 | $278,271 |
| 2021 | $6,004 | $409,290 | $136,475 | $272,815 |
| 2020 | $5,945 | $405,094 | $135,076 | $270,018 |
| 2019 | $5,710 | $397,152 | $132,428 | $264,724 |
| 2018 | $5,638 | $389,366 | $129,832 | $259,534 |
| 2017 | $5,426 | $381,733 | $127,287 | $254,446 |
| 2016 | $5,336 | $374,249 | $124,792 | $249,457 |
| 2015 | $5,163 | $368,628 | $122,918 | $245,710 |
| 2014 | $4,660 | $333,000 | $111,000 | $222,000 |
Source: Public Records
Map
Nearby Homes
- 1260 Aloise Ave
- 444 Pueblo Bonito Place
- 1630 Mathwig Dr
- 2721 Victoria Dr
- 2727 Victoria Dr
- 487 Hearn Ave
- 0 West Ave Unit 325019616
- 2154 Corby Ave
- 2632 Wild Bill Way
- 1911 Corby Ave
- 1447 Beachwood Dr
- 1953 Alamo Ln
- 1461 Trombetta St
- 2630 Arrowhead Dr
- 2599 Silver Spur Dr
- 2323 Calico Ln
- 101 Colgan Ave Unit 25
- 101 Colgan Ave Unit 24
- 101 Colgan Ave Unit 2
- 1245 Olive St
- 1205 Gloria Dr
- 1257 Gloria Dr
- 1233 Gloria Dr
- 1224 Valerie Way
- 1230 Valerie Way
- 1218 Valerie Way
- 1201 Gloria Dr
- 1202 Valerie Way
- 2330 West Ave
- 1279 Gloria Dr
- 1171 Gloria Dr
- 1148 Valerie Way
- 2314 West Ave
- 1256 Valerie Way
- 1136 Valerie Way
- 2304 West Ave
- 1236 Gloria Dr
- 1232 Gloria Dr
- 1248 Gloria Dr
- 1206 Gloria Dr