1215 Hilliard Rd San Marcos, TX 78666
Estimated payment $17,492/month
About This Lot
PRICE REDUCED
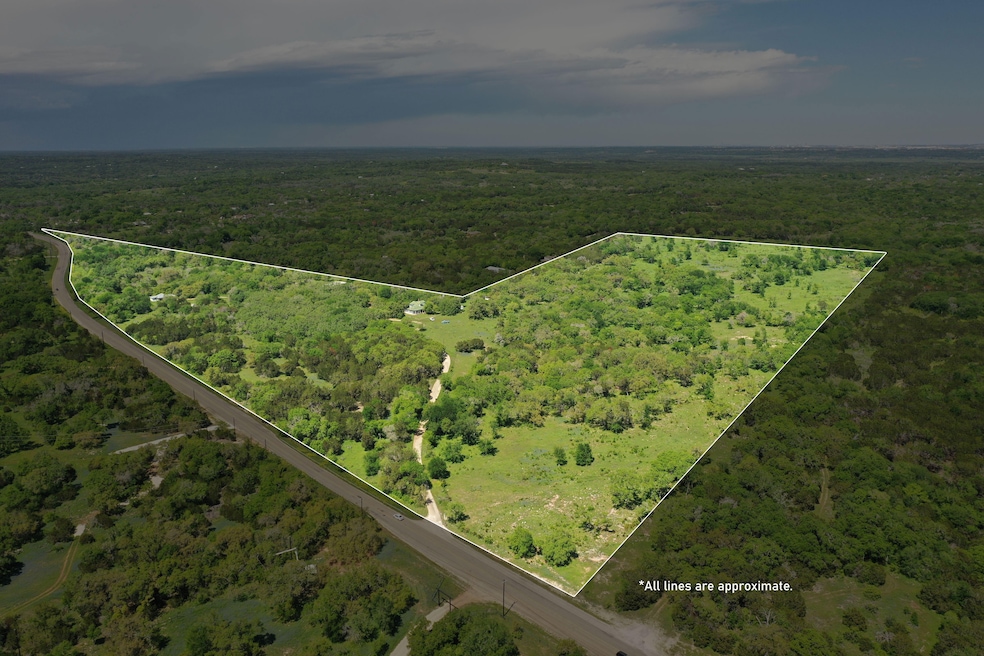
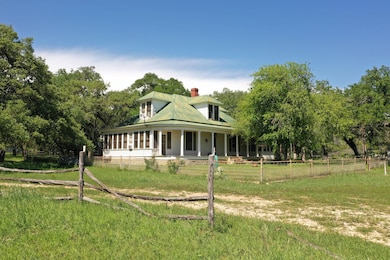
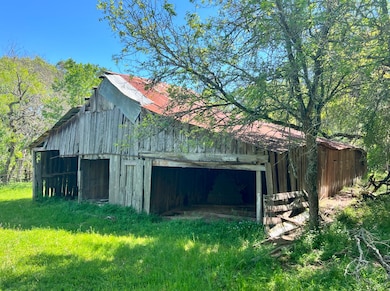
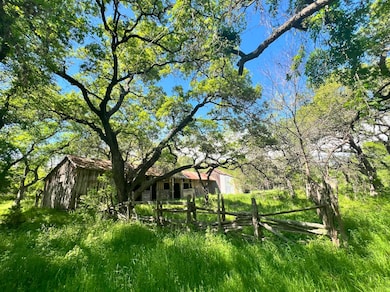
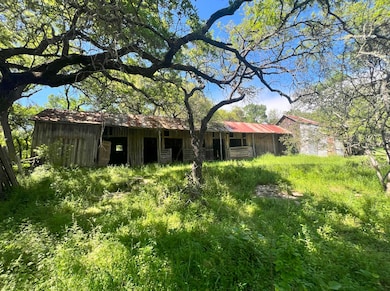
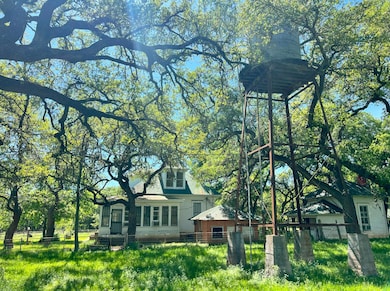
Small Texas Hill Country ranch close to San Marcos and Texas State University with improvements consisting of a 2406 SF home built in 1910 (per Hays CAD), guest cottage, various outbuildings and rustic barns typical of a ranch established in the early 1900s.
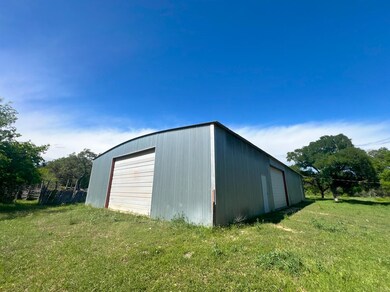
The property also includes an approx. 40' x 80' metal storage/equipment shop. Perimeter and cross-fences are in fair condition. The rustic time-period barns, corrals, cedar livestock pens and fencing all add to the classic Texas charm of this Hill Country ranch.
The property is covered in live oak trees and has been mostly cleared of cedars. Grass for livestock is abundant over the gently rolling topography.
The home and guest cottage is on septic and well(s) provide water to the improvements and various livestock troughs. Buyer is advised to have septic system inspected.
Agent:
Charles Harvey
TX #524308
512.814.1817

Property Details
Property Type
- Land
Est. Annual Taxes
- $3,104
Lot Details
- Many Trees
Map
Home Values in the Area
Average Home Value in this Area
Tax History
| Year | Tax Paid | Tax Assessment Tax Assessment Total Assessment is a certain percentage of the fair market value that is determined by local assessors to be the total taxable value of land and additions on the property. | Land | Improvement |
|---|---|---|---|---|
| 2025 | $3,104 | $201,050 | $16,030 | $185,020 |
| 2024 | $3,104 | $204,780 | $16,030 | $188,750 |
| 2023 | $2,911 | $201,050 | $16,030 | $185,020 |
| 2022 | $2,861 | $179,200 | $13,580 | $165,620 |
| 2021 | $2,771 | $156,760 | $8,300 | $148,460 |
| 2020 | $2,618 | $148,090 | $7,090 | $141,000 |
| 2019 | $2,780 | $142,720 | $6,190 | $136,530 |
| 2018 | $2,659 | $135,720 | $5,160 | $130,560 |
| 2017 | $2,566 | $129,990 | $4,650 | $125,340 |
| 2016 | $2,404 | $121,780 | $4,650 | $117,130 |
| 2015 | $1,154 | $114,840 | $4,430 | $110,410 |
Property History
| Date | Event | Price | List to Sale | Price per Sq Ft |
|---|---|---|---|---|
| 10/15/2025 10/15/25 | Price Changed | $3,269,700 | -10.0% | $1,359 / Sq Ft |
| 07/14/2025 07/14/25 | Off Market | -- | -- | -- |
| 07/16/2024 07/16/24 | For Sale | $3,633,000 | -- | $1,510 / Sq Ft |
- 210 Merrywood Ln
- TBD Hilliard Rd
- 211 Hunters Glen Rd
- 101 Hunters Glen Dr
- 601 Deertrail Dr
- 2011 Mustang Ln
- 128 Hazy View Rd
- 132 Hazy View Rd
- 136 Hazy View Rd
- 208 Hazy View Rd
- 212 Hazy View Rd
- 1700 Lime Kiln Rd Unit 4
- 419 Valley View Rd W
- 1306 Thousand Oaks Loop
- 4915 Palomino Dr
- 4920 Mustang Ln
- 830 Palomino Ln
- TBD Piedras Pass
- 501 Owl Hollow Rd
- 806 Sagewood Trail Unit 808
- 825 Sagewood Trail Unit 827
- 833 Sagewood Trail
- 202 Oak Ridge Dr
- 831 Sagewood Trail Unit 833
- 840 Sagewood Trail
- 121 Craddock Ave
- 844 Sagewood Trail Unit 844
- 855 Sagewood Trail
- 856 Sagewood Trail Unit 858
- 861 Sagewood Trail Unit 863
- 128 Cedargrove Unit 130
- 867 Sagewood Trail Unit 869
- 114 Cedargrove Unit 112
- 205 Craddock Ave Unit B1
- 205 Craddock Ave Unit F5
- 1027 Sagewood Trail
- 109 Hughson Ct Unit 111
- 108 Hughson Ct