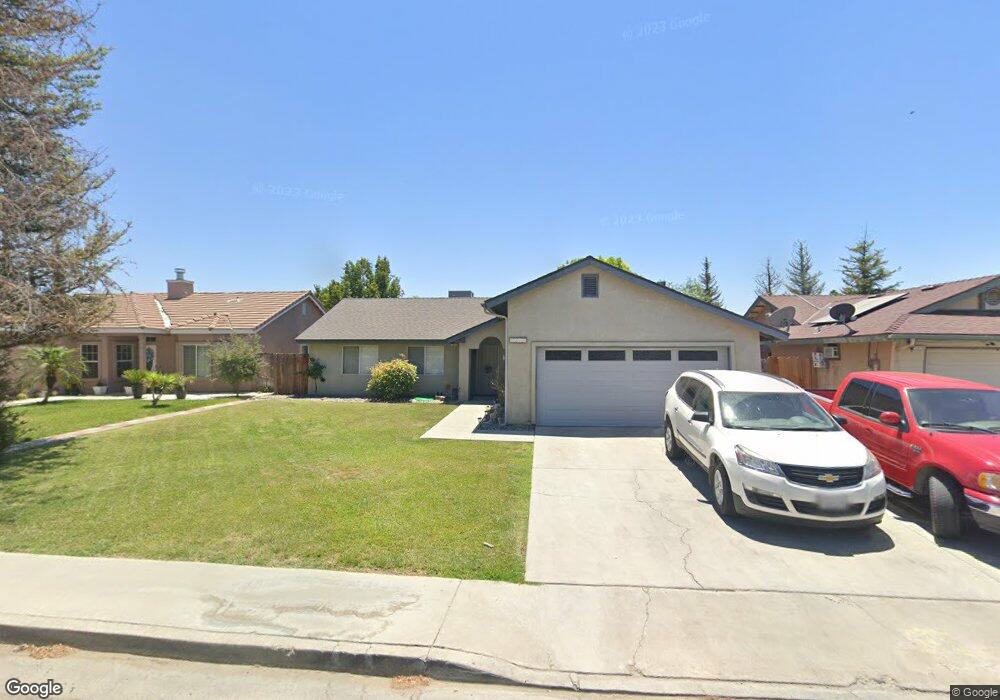
1215 North Ave Corcoran, CA 93212
Estimated Value: $255,000 - $286,000
4
Beds
2
Baths
1,137
Sq Ft
$239/Sq Ft
Est. Value
About This Home
This home is located at 1215 North Ave, Corcoran, CA 93212 and is currently estimated at $271,719, approximately $238 per square foot. 1215 North Ave is a home located in Kings County with nearby schools including John C. Fremont Elementary School, Bret Harte Elementary School, and Mark Twain Elementary School.
Ownership History
Date
Name
Owned For
Owner Type
Purchase Details
Closed on
Apr 8, 2002
Sold by
Hud
Bought by
Chavez Luis E and Chavez Griselda I
Current Estimated Value
Home Financials for this Owner
Home Financials are based on the most recent Mortgage that was taken out on this home.
Original Mortgage
$80,245
Outstanding Balance
$33,906
Interest Rate
7.08%
Mortgage Type
FHA
Estimated Equity
$237,813
Purchase Details
Closed on
Feb 7, 2002
Sold by
Chase Manhattan Mtg Corp
Bought by
Hud
Home Financials for this Owner
Home Financials are based on the most recent Mortgage that was taken out on this home.
Original Mortgage
$80,245
Outstanding Balance
$33,906
Interest Rate
7.08%
Mortgage Type
FHA
Estimated Equity
$237,813
Purchase Details
Closed on
Oct 25, 2001
Sold by
Coronado Luis and Coronado Eulalia
Bought by
Chase Manhattan Mtg Corp and Chemical Residential Mtg Corp
Create a Home Valuation Report for This Property
The Home Valuation Report is an in-depth analysis detailing your home's value as well as a comparison with similar homes in the area
Purchase History
| Date | Buyer | Sale Price | Title Company |
|---|---|---|---|
| Chavez Luis E | $80,000 | Fidelity National Title Co | |
| Hud | -- | First American Title Ins Co | |
| Chase Manhattan Mtg Corp | $87,444 | First American Title Co |
Source: Public Records
Mortgage History
| Date | Status | Borrower | Loan Amount |
|---|---|---|---|
| Open | Chavez Luis E | $80,245 |
Source: Public Records
Tax History
| Year | Tax Paid | Tax Assessment Tax Assessment Total Assessment is a certain percentage of the fair market value that is determined by local assessors to be the total taxable value of land and additions on the property. | Land | Improvement |
|---|---|---|---|---|
| 2025 | $1,153 | $118,182 | $29,543 | $88,639 |
| 2023 | $1,153 | $113,595 | $28,397 | $85,198 |
| 2022 | $1,113 | $111,369 | $27,841 | $83,528 |
| 2021 | $1,090 | $109,187 | $27,296 | $81,891 |
| 2020 | $1,067 | $108,067 | $27,016 | $81,051 |
| 2019 | $1,104 | $105,948 | $26,486 | $79,462 |
| 2018 | $1,085 | $103,871 | $25,967 | $77,904 |
| 2017 | $1,060 | $101,834 | $25,458 | $76,376 |
| 2016 | $1,004 | $99,837 | $24,959 | $74,878 |
| 2015 | $1,001 | $98,337 | $24,584 | $73,753 |
| 2014 | $982 | $96,410 | $24,102 | $72,308 |
Source: Public Records
Map
Nearby Homes
- 628 Norboe Ave
- 1326 Patterson Ave
- 1107 Patterson Ave
- 916 Norboe Ave
- 1500 Hanna Ave
- 726 Josephine Ave
- 508 Claire Ave
- 510 Claire Ave
- 1901 Patterson Ave
- 909 Flory Ave
- 0 Patterson Ave
- 915 Dairy Ave
- 147 5 1 2 Ave
- 2009 Charles St
- 1021 Claire Ave
- 1040 Josephine Ave
- 1516 Jepsen Ave
- 1217 Jepsen Ave
- 1121 Jepsen Ave
- 2023 Garvey Ave
- 1219 North Ave
- 1205 North Ave
- 1214 Bentley Dr
- 1300 Bentley Dr
- 1201 North Ave
- 1301 North Ave
- 1210 Bentley Dr
- 1320 Bentley Dr
- 1321 North Ave
- 1200 Bentley Dr
- 1328 Bentley Dr
- 1325 North Ave
- 1215 Bentley Dr
- 1205 N Bentley
- 1205 Bentley Dr
- 616 Burnett Dr
- 1201 Bentley Dr
- 609 Hale Ave
- 1161 North Ave
- 620 Burnett Dr
Your Personal Tour Guide
Ask me questions while you tour the home.