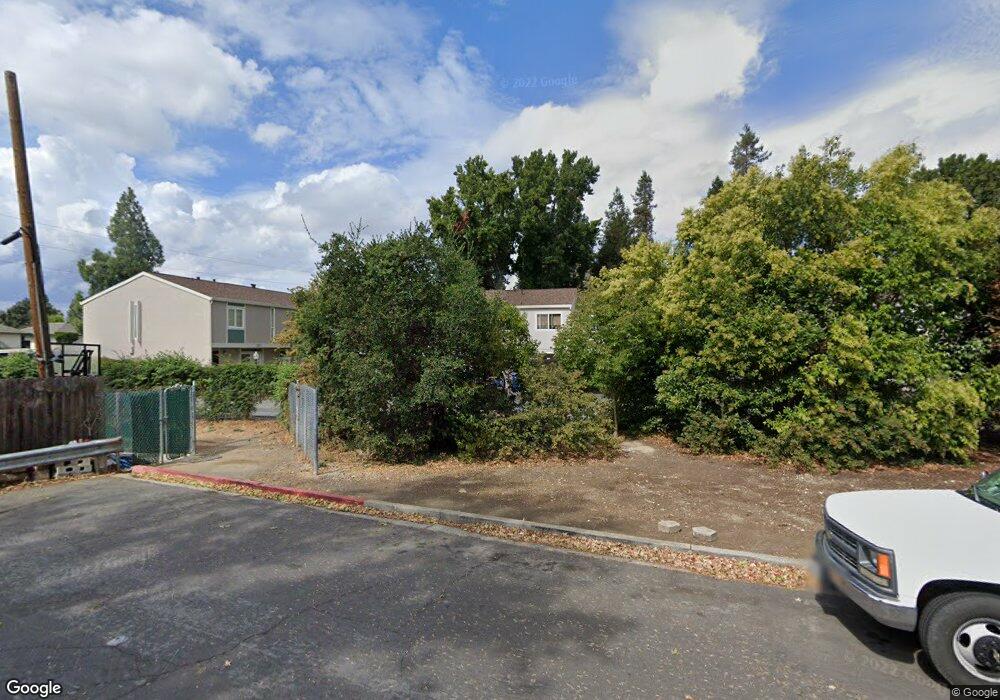
1215 Pine Creek Way Unit A Concord, CA 94520
Princess Park NeighborhoodEstimated Value: $366,187 - $440,000
2
Beds
2
Baths
1,089
Sq Ft
$373/Sq Ft
Est. Value
About This Home
This home is located at 1215 Pine Creek Way Unit A, Concord, CA 94520 and is currently estimated at $406,047, approximately $372 per square foot. 1215 Pine Creek Way Unit A is a home located in Contra Costa County with nearby schools including Meadow Homes Elementary School, Oak Grove Middle School, and Mt. Diablo High School.
Ownership History
Date
Name
Owned For
Owner Type
Purchase Details
Closed on
Mar 21, 2025
Sold by
Liang Curtis and Huang Lili
Bought by
Curtis Liang And Lili Huang Living Trust and Liang
Current Estimated Value
Purchase Details
Closed on
Oct 19, 2012
Sold by
Benyouref Hassan
Bought by
Liang Curtis and Huang Lili
Purchase Details
Closed on
Apr 17, 1995
Sold by
Sadik Aziza
Bought by
Benyouref Hassan
Home Financials for this Owner
Home Financials are based on the most recent Mortgage that was taken out on this home.
Original Mortgage
$84,956
Interest Rate
8.77%
Mortgage Type
FHA
Create a Home Valuation Report for This Property
The Home Valuation Report is an in-depth analysis detailing your home's value as well as a comparison with similar homes in the area
Home Values in the Area
Average Home Value in this Area
Purchase History
| Date | Buyer | Sale Price | Title Company |
|---|---|---|---|
| Curtis Liang And Lili Huang Living Trust | -- | None Listed On Document | |
| Liang Curtis | $108,000 | Chicago Title Company | |
| Benyouref Hassan | -- | Chicago Title Co | |
| Benyouref Hassan | $85,000 | Chicago Title Co |
Source: Public Records
Mortgage History
| Date | Status | Borrower | Loan Amount |
|---|---|---|---|
| Previous Owner | Benyouref Hassan | $84,956 |
Source: Public Records
Tax History
| Year | Tax Paid | Tax Assessment Tax Assessment Total Assessment is a certain percentage of the fair market value that is determined by local assessors to be the total taxable value of land and additions on the property. | Land | Improvement |
|---|---|---|---|---|
| 2025 | $2,460 | $132,982 | $26,347 | $106,635 |
| 2024 | $2,379 | $130,376 | $25,831 | $104,545 |
| 2023 | $2,312 | $127,821 | $25,325 | $102,496 |
| 2022 | $2,256 | $125,316 | $24,829 | $100,487 |
| 2021 | $2,182 | $122,860 | $24,343 | $98,517 |
| 2019 | $2,124 | $119,218 | $23,622 | $95,596 |
| 2018 | $2,031 | $116,881 | $23,159 | $93,722 |
| 2017 | $1,947 | $114,590 | $22,705 | $91,885 |
| 2016 | $1,864 | $112,344 | $22,260 | $90,084 |
| 2015 | $1,809 | $110,657 | $21,926 | $88,731 |
| 2014 | $1,747 | $108,490 | $21,497 | $86,993 |
Source: Public Records
Map
Nearby Homes
- 1133 Meadow Ln Unit 106
- 1133 Meadow Ln Unit 53
- 1255 Detroit Ave Unit 3
- 1260 Meadow Ln
- 1321 Tapestry Ln
- 1630 Nicholas Dr
- 1712 Oakmead Dr
- 2310 Belmont Rd
- 1439 Toyon Dr
- 1154 Tilson Dr
- 2361 Bedford Rd
- 2100 Laguna Cir Unit D
- 2045 Sierra Rd Unit 2
- 1520 Detroit Ave
- 1699 Laguna St Unit 302
- 2055 Sierra Rd Unit 12
- 2055 Sierra Rd Unit 53
- 2055 Sierra Rd Unit 101
- 2005 Sierra Rd
- 1139 Aspen Dr
- 1215 Pine Creek Way
- 1215 Pine Creek Way Unit I
- 1215 Pine Creek Way Unit H
- 1215 Pine Creek Way Unit G
- 1215 Pine Creek Way Unit F
- 1215 Pine Creek Way Unit E
- 1215 Pine Creek Way Unit D
- 1215 Pine Creek Way Unit C
- 1215 Pine Creek Way Unit B
- 1211 Pine Creek Way Unit A
- 1211 Pine Creek Way Unit B
- 1211 Pine Creek Way Unit C
- 1211 Pine Creek Way Unit D
- 1211 Pine Creek Way Unit E
- 1211 Pine Creek Way Unit F
- 1211 Pine Creek Way Unit G
- 1211 Pine Creek Way Unit H
- 1211 Pine Creek Way Unit I
- 1237 Pine Creek Way
- 1237 Pine Creek Way Unit A
Your Personal Tour Guide
Ask me questions while you tour the home.