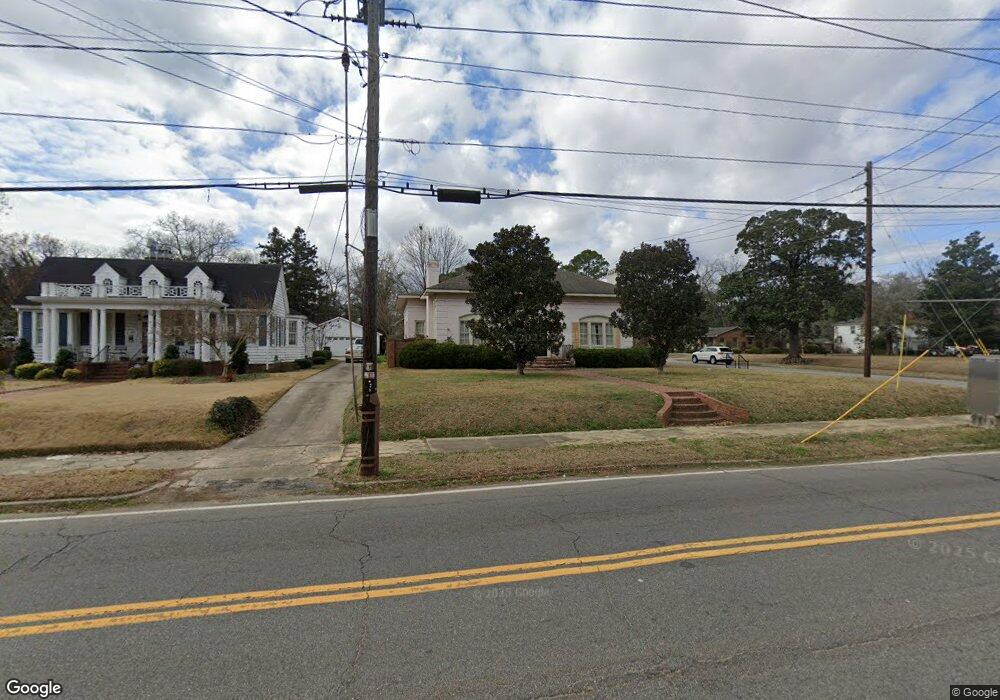
1215 S Lee St Americus, GA 31709
Estimated Value: $148,000 - $258,000
3
Beds
2
Baths
2,667
Sq Ft
$75/Sq Ft
Est. Value
About This Home
This home is located at 1215 S Lee St, Americus, GA 31709 and is currently estimated at $198,765, approximately $74 per square foot. 1215 S Lee St is a home located in Sumter County with nearby schools including Sumter County Primary School, Sumter County Elementary School, and Sumter County Middle School.
Ownership History
Date
Name
Owned For
Owner Type
Purchase Details
Closed on
Dec 12, 2023
Sold by
Dunmon Kenneth Earl
Bought by
Dunmon Long Lauren Paige
Current Estimated Value
Purchase Details
Closed on
Jun 17, 2015
Sold by
Federal National Mortgage Association
Bought by
Dunmon Kenneth Earl
Purchase Details
Closed on
Dec 2, 2014
Sold by
Oraka Emeka
Bought by
Federal National Mtg Associati
Purchase Details
Closed on
Sep 25, 2013
Sold by
Butler Gwendolyn King
Bought by
Butler Gwendolyn K
Purchase Details
Closed on
Jul 11, 2005
Sold by
Oraka Chika S
Bought by
Oraka Emeka
Purchase Details
Closed on
Nov 24, 2003
Sold by
Roberts Richard R
Bought by
Oraka Chika C
Purchase Details
Closed on
May 5, 1994
Bought by
Roberts Richard R
Purchase Details
Closed on
Oct 11, 1993
Bought by
Krinsky Gerald
Purchase Details
Closed on
Nov 20, 1951
Bought by
Krinsky Bernice W
Create a Home Valuation Report for This Property
The Home Valuation Report is an in-depth analysis detailing your home's value as well as a comparison with similar homes in the area
Home Values in the Area
Average Home Value in this Area
Purchase History
| Date | Buyer | Sale Price | Title Company |
|---|---|---|---|
| Dunmon Long Lauren Paige | -- | -- | |
| Dunmon Kenneth Earl | $67,000 | -- | |
| Federal National Mtg Associati | -- | -- | |
| Butler Gwendolyn K | -- | -- | |
| Oraka Emeka | -- | -- | |
| Oraka Chika C | $98,000 | -- | |
| Roberts Richard R | $89,000 | -- | |
| Krinsky Gerald | -- | -- | |
| Krinsky Bernice W | -- | -- |
Source: Public Records
Tax History Compared to Growth
Tax History
| Year | Tax Paid | Tax Assessment Tax Assessment Total Assessment is a certain percentage of the fair market value that is determined by local assessors to be the total taxable value of land and additions on the property. | Land | Improvement |
|---|---|---|---|---|
| 2024 | $2,284 | $50,640 | $4,120 | $46,520 |
| 2023 | $2,234 | $50,640 | $4,120 | $46,520 |
| 2022 | $1,530 | $50,640 | $4,120 | $46,520 |
| 2021 | $2,238 | $50,640 | $4,120 | $46,520 |
| 2020 | $2,291 | $50,640 | $4,120 | $46,520 |
| 2019 | $2,423 | $50,640 | $4,120 | $46,520 |
| 2018 | $1,593 | $50,640 | $4,120 | $46,520 |
| 2017 | $1,593 | $50,640 | $4,120 | $46,520 |
| 2016 | $1,184 | $50,640 | $4,120 | $46,520 |
| 2015 | $1,797 | $58,680 | $4,120 | $54,560 |
| 2014 | $1,800 | $58,680 | $4,120 | $54,560 |
| 2013 | -- | $58,680 | $4,120 | $54,560 |
Source: Public Records
Map
Nearby Homes
- 1219 S Lee St
- 116 W Glessner St
- 113 W Glessner St
- 118 W Glessner St
- 1122 S Lee St
- 1115 S Lee St
- 1121 S Lee St
- 1134 S Lee St
- 1118 S Lee St
- 1223 S Lee St
- 1216 S Lee St
- 117 W Glessner St
- 124 W Glessner St
- 1222 S Lee St
- 106 E Glessner St
- 119 W Glessner St
- 1116 S Lee St
- 1105 S Lee St
- 1212 Hancock Dr
- 125 W Glessner St