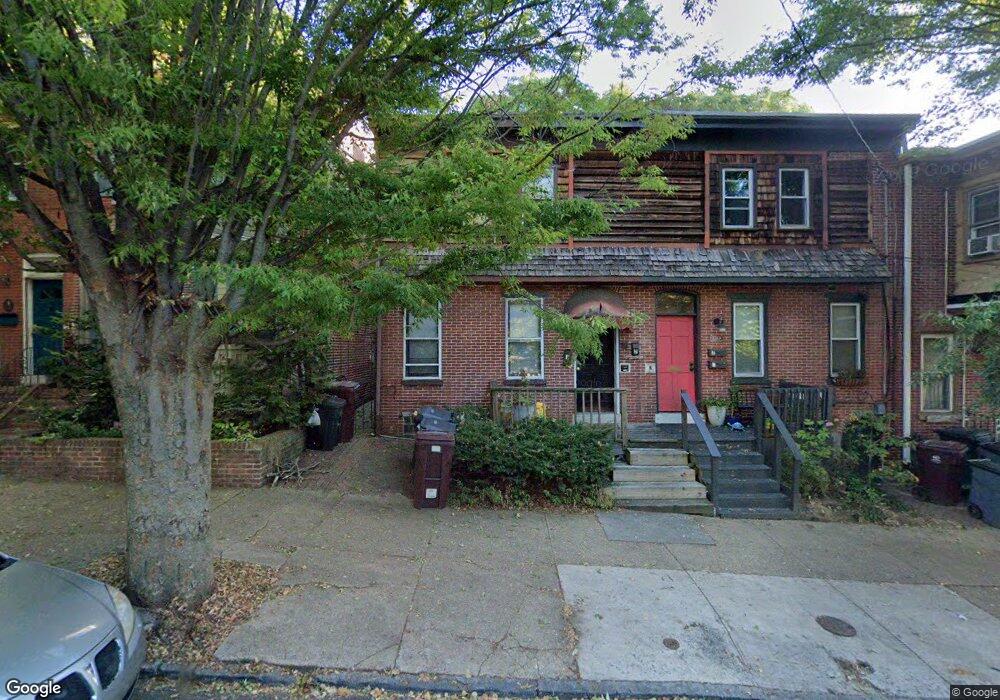
1215 W 7th St Wilmington, DE 19805
Cool Spring-Tilton Park NeighborhoodEstimated Value: $221,000 - $338,000
4
Beds
2
Baths
1,854
Sq Ft
$149/Sq Ft
Est. Value
About This Home
This is a one bedroom unit that will be available December 1st located in the Cool Spring section of Wilmington Delaware, less than a mile from Trolley Square. This unit comes with a laundry room that has both a washer and dryer, central air and heating, a long dish washer and all new appliances. This unit also has a spacious family area and a beautiful brick backsplash. This unit is very close to 95 which means it’s easy to get from point A to B. This property is situated in a beautiful neighborhood that is safe and surrounded by good people. This is a non smoking unit and no pets are allowed. Water, trash and sewage included in rent.
Ownership History
Date
Name
Owned For
Owner Type
Purchase Details
Closed on
Mar 23, 2021
Sold by
Hubbard Kyle H
Bought by
Pugh Jocelyn
Current Estimated Value
Home Financials for this Owner
Home Financials are based on the most recent Mortgage that was taken out on this home.
Original Mortgage
$186,558
Outstanding Balance
$167,321
Interest Rate
2.73%
Mortgage Type
FHA
Estimated Equity
$109,684
Purchase Details
Closed on
Mar 27, 2007
Sold by
Jackson Joseph M and Jackson Teresa A D
Bought by
Hubbard Kyle H
Home Financials for this Owner
Home Financials are based on the most recent Mortgage that was taken out on this home.
Original Mortgage
$166,583
Interest Rate
6.33%
Mortgage Type
FHA
Create a Home Valuation Report for This Property
The Home Valuation Report is an in-depth analysis detailing your home's value as well as a comparison with similar homes in the area
Home Values in the Area
Average Home Value in this Area
Purchase History
| Date | Buyer | Sale Price | Title Company |
|---|---|---|---|
| Pugh Jocelyn | -- | None Available | |
| Hubbard Kyle H | $167,900 | None Available |
Source: Public Records
Mortgage History
| Date | Status | Borrower | Loan Amount |
|---|---|---|---|
| Open | Pugh Jocelyn | $186,558 | |
| Previous Owner | Hubbard Kyle H | $166,583 |
Source: Public Records
Property History
| Date | Event | Price | List to Sale | Price per Sq Ft |
|---|---|---|---|---|
| 02/10/2025 02/10/25 | Off Market | -- | -- | -- |
| 01/16/2025 01/16/25 | For Rent | -- | -- | -- |
Tax History Compared to Growth
Tax History
| Year | Tax Paid | Tax Assessment Tax Assessment Total Assessment is a certain percentage of the fair market value that is determined by local assessors to be the total taxable value of land and additions on the property. | Land | Improvement |
|---|---|---|---|---|
| 2024 | $1,935 | $62,000 | $10,800 | $51,200 |
| 2023 | $1,681 | $62,000 | $10,800 | $51,200 |
| 2022 | $1,689 | $62,000 | $10,800 | $51,200 |
| 2021 | $1,686 | $62,000 | $10,800 | $51,200 |
| 2020 | $1,696 | $62,000 | $10,800 | $51,200 |
| 2019 | $2,942 | $62,000 | $10,800 | $51,200 |
| 2018 | $1,211 | $62,000 | $10,800 | $51,200 |
| 2017 | $2,747 | $62,000 | $10,800 | $51,200 |
| 2016 | $2,747 | $62,000 | $10,800 | $51,200 |
| 2015 | $2,627 | $62,000 | $10,800 | $51,200 |
| 2014 | $2,494 | $62,000 | $10,800 | $51,200 |
Source: Public Records
Map
Nearby Homes
- 615 N Harrison St
- 1222 Mccoy Way
- 1204 W 8th St
- 602 N Harrison St
- 1327 W 6th St
- 1318 W 6th St
- 614 N Broom St
- 1308 W 5th St
- 1017 W 7th St
- 808 N Van Buren St
- 1407 W 6th St
- 621 N Jackson St
- 305 N Franklin St
- 1102 W 4th St
- 1409 W 4th St
- 1212 W 3rd St
- 1312 W 3rd St
- 1322 W 3rd St
- 1130 W 3rd St
- 506 Delamore Place
- 1215 W 7th St Unit 2
- 1215 W 7th St Unit 1
- 1215 W 7th St
- 1213 W 7th St
- 1217 W 7th St
- 1211 W 7th St
- 1209 W 7th St
- 1207 W 7th St Unit COOL
- 1207 W 7th St
- 701 N Harrison St Unit COOL
- 701 N Harrison St
- 1205 W 7th St
- 703 N Harrison St
- 710 N Franklin St
- 705 N Harrison St
- 706 N Franklin St
- 704 N Franklin St Unit 2
- 704 N Franklin St Unit 1
- 704 N Franklin St Unit 3
- 704 N Franklin St Unit 2