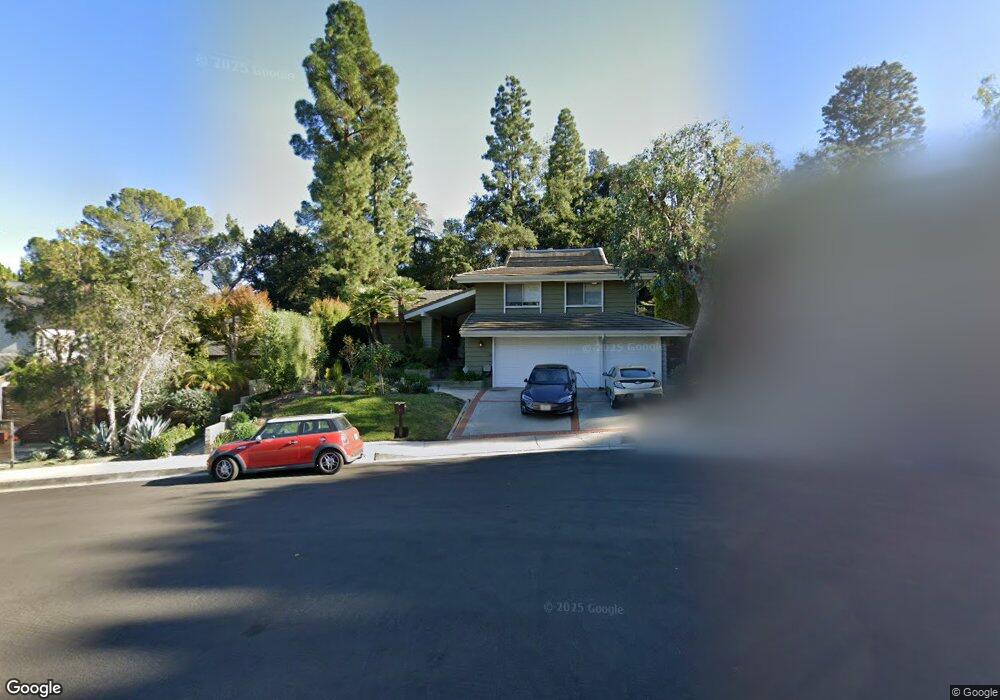
12152 La Casa Ln Los Angeles, CA 90049
Brentwood NeighborhoodEstimated Value: $3,487,817 - $4,106,000
4
Beds
3
Baths
3,304
Sq Ft
$1,173/Sq Ft
Est. Value
About This Home
This home is located at 12152 La Casa Ln, Los Angeles, CA 90049 and is currently estimated at $3,873,954, approximately $1,172 per square foot. 12152 La Casa Ln is a home located in Los Angeles County with nearby schools including Kenter Canyon Elementary School, Paul Revere Charter Middle School, and University High School Charter.
Ownership History
Date
Name
Owned For
Owner Type
Purchase Details
Closed on
Dec 11, 2020
Sold by
Miller Becky J and Miller Wilkie
Bought by
Cheong Family Trust and Cheong
Current Estimated Value
Purchase Details
Closed on
Sep 24, 2020
Sold by
Cheong Wilkie and Miller Becky J
Bought by
Miller Becky J and Cheong Wilkie
Home Financials for this Owner
Home Financials are based on the most recent Mortgage that was taken out on this home.
Original Mortgage
$510,400
Interest Rate
2.9%
Mortgage Type
New Conventional
Purchase Details
Closed on
Nov 15, 1995
Sold by
Schiffman Fred M and Schiffman Myrna M
Bought by
Cheong Wilkie and Cheong Becky Miller
Home Financials for this Owner
Home Financials are based on the most recent Mortgage that was taken out on this home.
Original Mortgage
$410,000
Interest Rate
7.47%
Create a Home Valuation Report for This Property
The Home Valuation Report is an in-depth analysis detailing your home's value as well as a comparison with similar homes in the area
Home Values in the Area
Average Home Value in this Area
Purchase History
| Date | Buyer | Sale Price | Title Company |
|---|---|---|---|
| Cheong Family Trust | -- | None Listed On Document | |
| Miller Becky J | -- | Fidelity National Title Co | |
| Cheong Wilkie | $710,000 | Commonwealth Land Title Co |
Source: Public Records
Mortgage History
| Date | Status | Borrower | Loan Amount |
|---|---|---|---|
| Previous Owner | Miller Becky J | $510,400 | |
| Previous Owner | Cheong Wilkie | $410,000 |
Source: Public Records
Tax History Compared to Growth
Tax History
| Year | Tax Paid | Tax Assessment Tax Assessment Total Assessment is a certain percentage of the fair market value that is determined by local assessors to be the total taxable value of land and additions on the property. | Land | Improvement |
|---|---|---|---|---|
| 2025 | $14,360 | $1,179,484 | $797,405 | $382,079 |
| 2024 | $14,360 | $1,156,358 | $781,770 | $374,588 |
| 2023 | $14,088 | $1,133,686 | $766,442 | $367,244 |
| 2022 | $13,445 | $1,111,458 | $751,414 | $360,044 |
| 2021 | $13,268 | $1,089,666 | $736,681 | $352,985 |
| 2020 | $13,399 | $1,078,494 | $729,128 | $349,366 |
| 2019 | $12,874 | $1,057,348 | $714,832 | $342,516 |
| 2018 | $12,773 | $1,036,616 | $700,816 | $335,800 |
| 2016 | $12,201 | $996,364 | $673,603 | $322,761 |
| 2015 | $12,024 | $981,398 | $663,485 | $317,913 |
| 2014 | $12,067 | $962,175 | $650,489 | $311,686 |
Source: Public Records
Map
Nearby Homes
- 800 N Tigertail Rd
- 740 Norway Ln
- 815 N Tigertail Rd
- 12148 Travis St
- 737 Halliday Ave
- 590 N Tigertail Rd
- 12400 Deerbrook Ln
- 721 N Bonhill Rd
- 924 Stonehill Ln
- 898 N Bundy Dr
- 684 Firth Ave
- 810 Bramble Way
- 560 N Tigertail Rd
- 933 Bluegrass Ln
- 11929 Brentwood Grove Dr
- 966 Bluegrass Ln
- 601 Tuallitan Rd
- 491 N Tigertail Rd
- 1000 N Norman Place
- 1024 Lindenwood Ln
- 12146 La Casa Ln
- 12156 La Casa Ln
- 815 Lockearn St
- 12138 La Casa Ln
- 12160 La Casa Ln
- 12265 Castlegate Dr
- 12157 La Casa Ln
- 12126 La Casa Ln
- 809 Lockearn St
- 12145 La Casa Ln
- 12131 La Casa Ln
- 660 N Tigertail Rd
- 12151 La Casa Ln
- 12118 La Casa Ln
- 801 Lockearn St
- 650 N Tigertail Rd
- 814 Lockearn St
- 694 N Tigertail Rd
- 12125 La Casa Ln
- 808 Lockearn St