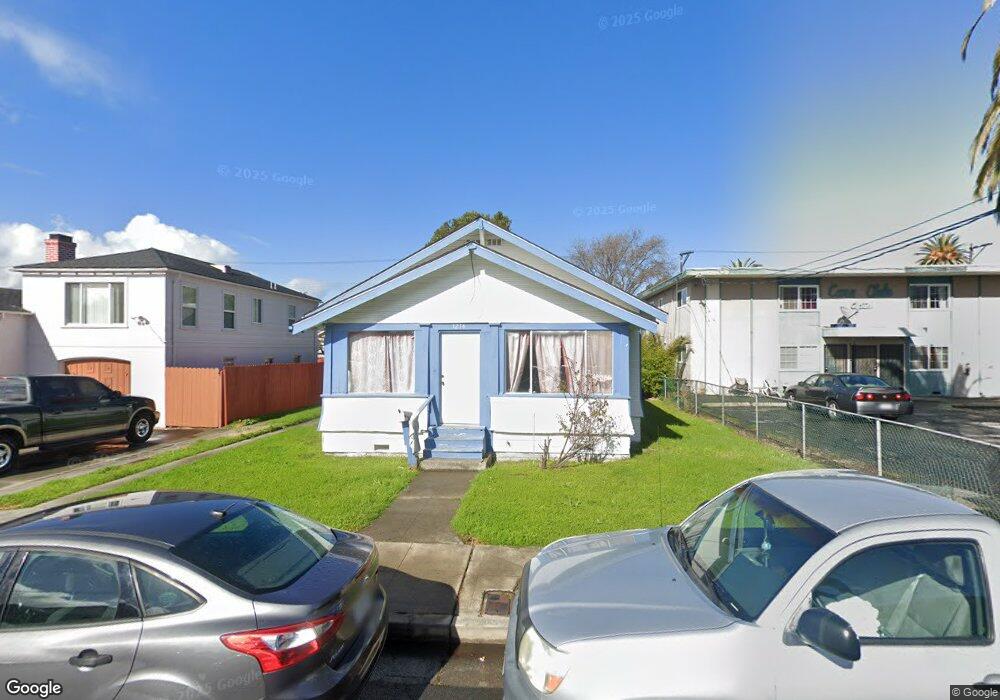
1216 Ohio St Vallejo, CA 94590
West Vallejo NeighborhoodEstimated Value: $405,000 - $462,000
3
Beds
1
Bath
1,060
Sq Ft
$413/Sq Ft
Est. Value
About This Home
This home is located at 1216 Ohio St, Vallejo, CA 94590 and is currently estimated at $437,782, approximately $413 per square foot. 1216 Ohio St is a home located in Solano County with nearby schools including Highland Elementary, Vallejo High School, and Caliber: ChangeMakers Academy.
Ownership History
Date
Name
Owned For
Owner Type
Purchase Details
Closed on
Oct 6, 2005
Sold by
Choyce Timothy
Bought by
Choyce Clifton H
Current Estimated Value
Purchase Details
Closed on
Sep 28, 2005
Sold by
Choyce Eleasia
Bought by
Choyce Clifton H
Purchase Details
Closed on
Jul 22, 1999
Sold by
Choyce James H
Bought by
Choyce James H and Choyce James
Create a Home Valuation Report for This Property
The Home Valuation Report is an in-depth analysis detailing your home's value as well as a comparison with similar homes in the area
Home Values in the Area
Average Home Value in this Area
Purchase History
| Date | Buyer | Sale Price | Title Company |
|---|---|---|---|
| Choyce Clifton H | $26,000 | -- | |
| Choyce Clifton H | $26,000 | -- | |
| Choyce Clifton H | $4,000 | -- | |
| Choyce Clifton H | $4,000 | -- | |
| Choyce Clifton H | $26,000 | -- | |
| Choyce James H | -- | -- |
Source: Public Records
Tax History
| Year | Tax Paid | Tax Assessment Tax Assessment Total Assessment is a certain percentage of the fair market value that is determined by local assessors to be the total taxable value of land and additions on the property. | Land | Improvement |
|---|---|---|---|---|
| 2025 | $5,744 | $422,738 | $112,473 | $310,265 |
| 2024 | $5,744 | $414,450 | $110,268 | $304,182 |
| 2023 | $5,436 | $406,324 | $108,106 | $298,218 |
| 2022 | $5,351 | $398,358 | $105,987 | $292,371 |
| 2021 | $5,233 | $390,548 | $103,909 | $286,639 |
| 2020 | $5,269 | $378,966 | $100,828 | $278,138 |
| 2019 | $5,121 | $371,536 | $98,851 | $272,685 |
| 2018 | $4,761 | $368,000 | $66,000 | $302,000 |
| 2017 | $3,493 | $265,000 | $50,000 | $215,000 |
| 2016 | $2,845 | $253,000 | $50,000 | $203,000 |
| 2015 | $2,258 | $201,000 | $42,000 | $159,000 |
| 2014 | $1,961 | $174,000 | $38,000 | $136,000 |
Source: Public Records
Map
Nearby Homes
Your Personal Tour Guide
Ask me questions while you tour the home.