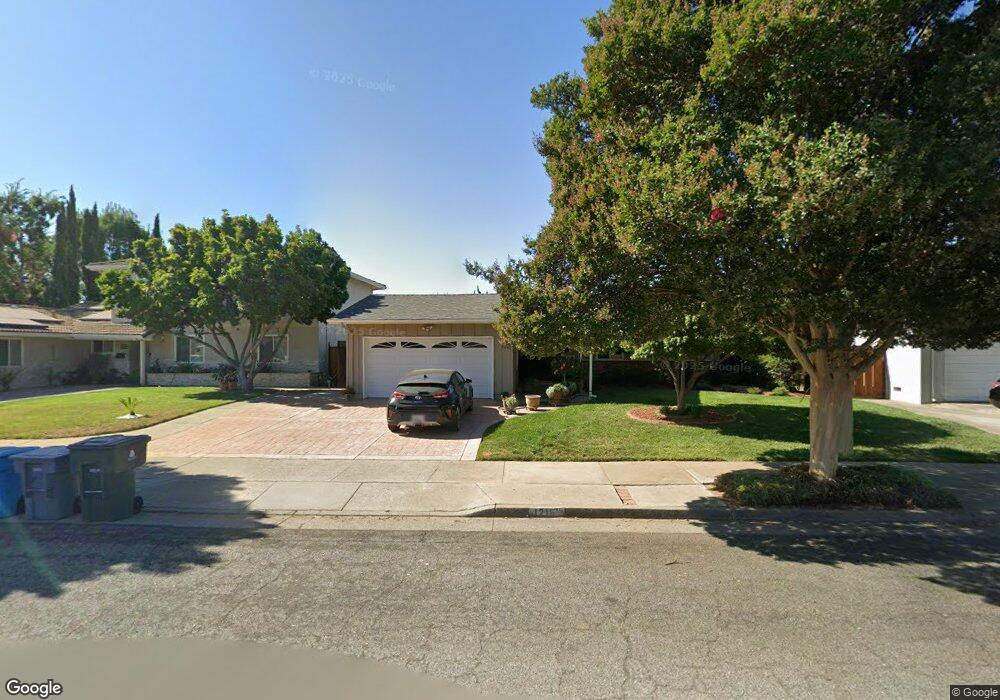
1216 Swaner Dr Gilroy, CA 95020
Las Animas NeighborhoodEstimated Value: $768,000 - $875,000
3
Beds
2
Baths
1,252
Sq Ft
$656/Sq Ft
Est. Value
About This Home
This home is located at 1216 Swaner Dr, Gilroy, CA 95020 and is currently estimated at $821,121, approximately $655 per square foot. 1216 Swaner Dr is a home located in Santa Clara County with nearby schools including Rod Kelley Elementary School, Solorsano Middle School, and South Valley Middle School.
Ownership History
Date
Name
Owned For
Owner Type
Purchase Details
Closed on
Sep 10, 2012
Sold by
Mar Francisco E and Mar Mercedes
Bought by
The Mar Family Trust and Mar Francisco E
Current Estimated Value
Purchase Details
Closed on
Sep 13, 2011
Sold by
Mar Francisco E and Mar Mercedes
Bought by
Mar Francisco E and Mar Mercedes
Purchase Details
Closed on
Jan 14, 2009
Sold by
Mar Francisco E and Mar Mercedes
Bought by
Mar Francisco E and Mar Mercedes
Home Financials for this Owner
Home Financials are based on the most recent Mortgage that was taken out on this home.
Original Mortgage
$191,000
Interest Rate
5.14%
Mortgage Type
New Conventional
Purchase Details
Closed on
Jan 18, 2005
Sold by
Mar Francisco E and Mar Mercedes
Bought by
Mar Francisco E and Mar Mercedes
Create a Home Valuation Report for This Property
The Home Valuation Report is an in-depth analysis detailing your home's value as well as a comparison with similar homes in the area
Home Values in the Area
Average Home Value in this Area
Purchase History
| Date | Buyer | Sale Price | Title Company |
|---|---|---|---|
| The Mar Family Trust | -- | None Available | |
| Mar Francisco E | -- | None Available | |
| Mar Francisco E | -- | Old Republic Title Company | |
| Mar Francisco | -- | Old Republic Title Company | |
| Mar Francisco E | -- | -- |
Source: Public Records
Mortgage History
| Date | Status | Borrower | Loan Amount |
|---|---|---|---|
| Closed | Mar Francisco | $191,000 |
Source: Public Records
Tax History
| Year | Tax Paid | Tax Assessment Tax Assessment Total Assessment is a certain percentage of the fair market value that is determined by local assessors to be the total taxable value of land and additions on the property. | Land | Improvement |
|---|---|---|---|---|
| 2025 | $1,780 | $309,433 | $106,086 | $203,347 |
| 2024 | $1,780 | $303,366 | $104,006 | $199,360 |
| 2023 | $1,835 | $297,418 | $101,967 | $195,451 |
| 2022 | $1,902 | $291,587 | $99,968 | $191,619 |
| 2021 | $1,886 | $285,870 | $98,008 | $187,862 |
| 2020 | $1,898 | $282,940 | $97,004 | $185,936 |
| 2019 | $1,895 | $277,393 | $95,102 | $182,291 |
| 2018 | $1,799 | $271,955 | $93,238 | $178,717 |
| 2017 | $1,851 | $266,623 | $91,410 | $175,213 |
| 2016 | $3,424 | $261,396 | $89,618 | $171,778 |
| 2015 | $3,233 | $257,470 | $88,272 | $169,198 |
| 2014 | $3,213 | $252,427 | $86,543 | $165,884 |
Source: Public Records
Map
Nearby Homes
- 1008 Primrose Ln
- 8120 Catalina Ct
- 1555 Hecker Pass Rd Unit H102
- 7942 English Oak Cir
- 7902 English Oak Cir
- 1610 Calabrese Way
- 1392 Mantelli Dr
- 1206 Sycamore Ct
- 1330 Redwood Ln
- 1510 Welburn Ave
- 8255 Rancho Real
- 1750 Vista Del Sur
- 1320 Heritage Way
- 0 California 152
- 1404 Casablanca Cir
- 735 Painter Ct
- 760 Welburn Ave
- 7611 Westwood Dr
- 1165 Lerma Ln
- 7969 Kipling Cir
- 1224 Swaner Dr
- 1208 Swaner Dr
- 1232 Swaner Dr
- 1200 Swaner Dr
- 1223 Swaner Dr
- 8225 Kelton Dr
- 1215 Swaner Dr
- 1231 Swaner Dr
- 1240 Swaner Dr
- 8313 Kelton Dr
- 8203 Kelton Dr
- 8203 Kelton Dr Unit 1
- 8325 Kelton Dr
- 1248 Swaner Dr
- 1247 Swaner Dr
- 1232 Pappani Dr
- 1224 Pappani Dr
- 1240 Pappani Dr
- 8272 Kelton Dr
- 8197 Kelton Dr
Your Personal Tour Guide
Ask me questions while you tour the home.