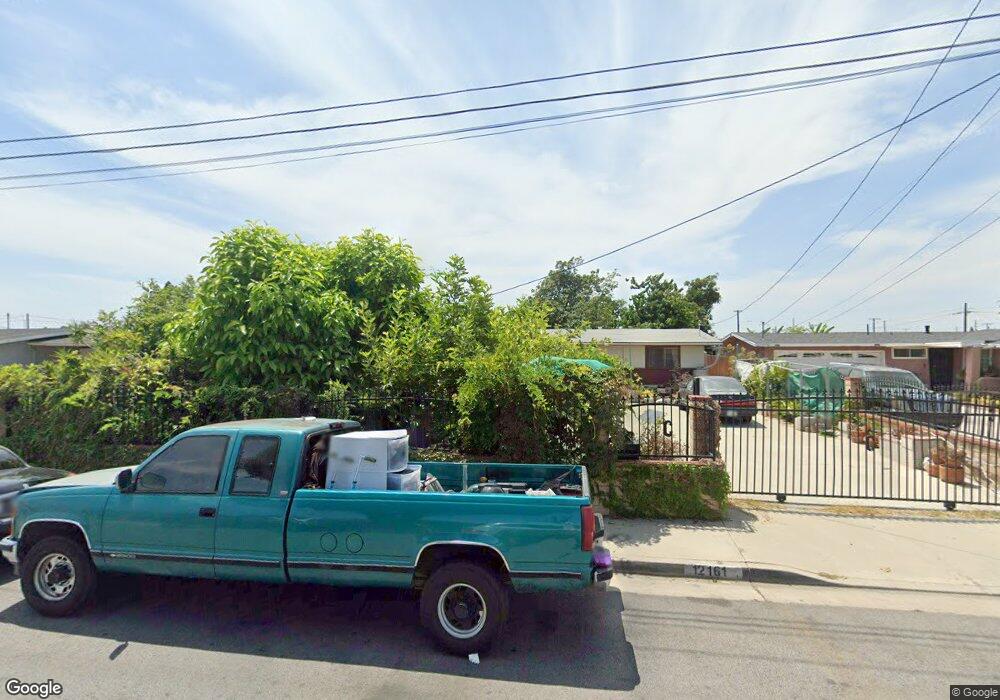
12161 Haga St Garden Grove, CA 92841
Estimated Value: $900,620 - $1,054,000
4
Beds
2
Baths
1,207
Sq Ft
$810/Sq Ft
Est. Value
About This Home
This home is located at 12161 Haga St, Garden Grove, CA 92841 and is currently estimated at $977,905, approximately $810 per square foot. 12161 Haga St is a home located in Orange County with nearby schools including Lawrence Elementary School, Alamitos Intermediate School, and Rancho Alamitos High School.
Ownership History
Date
Name
Owned For
Owner Type
Purchase Details
Closed on
Feb 3, 2018
Sold by
Antron Dinha
Bought by
Tran Vanessa Meriden and Tran Revocable Trsut
Current Estimated Value
Purchase Details
Closed on
May 4, 2017
Sold by
Chan Ken Han
Bought by
Tran Dinh An and Dinh An Tran Revocable Trust
Purchase Details
Closed on
Feb 22, 2005
Sold by
Dinh An Tran Revocable Trust
Bought by
Chan Ken Han and Dinh An Tran Revocable Trust
Purchase Details
Closed on
Dec 29, 2003
Sold by
Tran Dinh An
Bought by
Dinh An Tran Revocable Trust and Tran Phong Hanh
Purchase Details
Closed on
Feb 2, 1994
Sold by
Allred Craig K and Allred Bonita J
Bought by
Mayora Edwin and Mayora Flor
Home Financials for this Owner
Home Financials are based on the most recent Mortgage that was taken out on this home.
Original Mortgage
$141,100
Interest Rate
7.15%
Mortgage Type
FHA
Create a Home Valuation Report for This Property
The Home Valuation Report is an in-depth analysis detailing your home's value as well as a comparison with similar homes in the area
Home Values in the Area
Average Home Value in this Area
Purchase History
| Date | Buyer | Sale Price | Title Company |
|---|---|---|---|
| Tran Vanessa Meriden | -- | None Available | |
| Tran Dinh An | -- | None Available | |
| Chan Ken Han | -- | -- | |
| Dinh An Tran Revocable Trust | -- | -- | |
| Mayora Edwin | $147,000 | Chicago Title Company |
Source: Public Records
Mortgage History
| Date | Status | Borrower | Loan Amount |
|---|---|---|---|
| Previous Owner | Mayora Edwin | $141,100 |
Source: Public Records
Tax History Compared to Growth
Tax History
| Year | Tax Paid | Tax Assessment Tax Assessment Total Assessment is a certain percentage of the fair market value that is determined by local assessors to be the total taxable value of land and additions on the property. | Land | Improvement |
|---|---|---|---|---|
| 2025 | $3,570 | $298,832 | $200,778 | $98,054 |
| 2024 | $3,570 | $292,973 | $196,841 | $96,132 |
| 2023 | $3,501 | $287,229 | $192,981 | $94,248 |
| 2022 | $3,424 | $281,598 | $189,198 | $92,400 |
| 2021 | $3,389 | $276,077 | $185,488 | $90,589 |
| 2020 | $3,343 | $273,247 | $183,586 | $89,661 |
| 2019 | $3,281 | $267,890 | $179,987 | $87,903 |
| 2018 | $3,215 | $262,638 | $176,458 | $86,180 |
| 2017 | $3,171 | $257,489 | $172,998 | $84,491 |
| 2016 | $3,038 | $252,441 | $169,606 | $82,835 |
| 2015 | $2,995 | $248,650 | $167,059 | $81,591 |
| 2014 | $2,921 | $243,780 | $163,787 | $79,993 |
Source: Public Records
Map
Nearby Homes
- 12101 Dale Ave Unit 69
- 12101 Dale Ave Unit 44
- 8895 Sequoia Ct
- 11841 Magnolia St
- 12562 Dale St Unit 47
- 8185 Del Rey Dr
- 9022 Marlene Ave
- 11791 Nearing Dr
- 12315 Westcliff Dr
- 11912 Arthur Dr
- 9052 Marie Ln
- 28 Bigsby Dr
- 47 Bigsby Dr
- 11691 Faun Ln
- 43 Bigsby Dr
- 8732 Orangewood Ave
- 9041 Shelley Dr
- 12071 Marlowe Dr
- 8102 La Monte Rd
- 8111 Stanford Ave
- 12181 Haga St
- 12151 Haga St
- 8612 Blanche Ave
- 12191 Haga St
- 8602 Blanche Ave
- 12162 Haga St
- 12201 Haga St
- 12182 Haga St
- 12152 Haga St
- 8601 Barr Ln
- 8592 Blanche Ave
- 12192 Haga St
- 8621 Blanche Ave
- 8631 Blanche Ave
- 8611 Blanche Ave
- 8651 Blanche Ave
- 12211 Haga St
- 8591 Barr Ln
- 12202 Haga St
- 8601 Blanche Ave