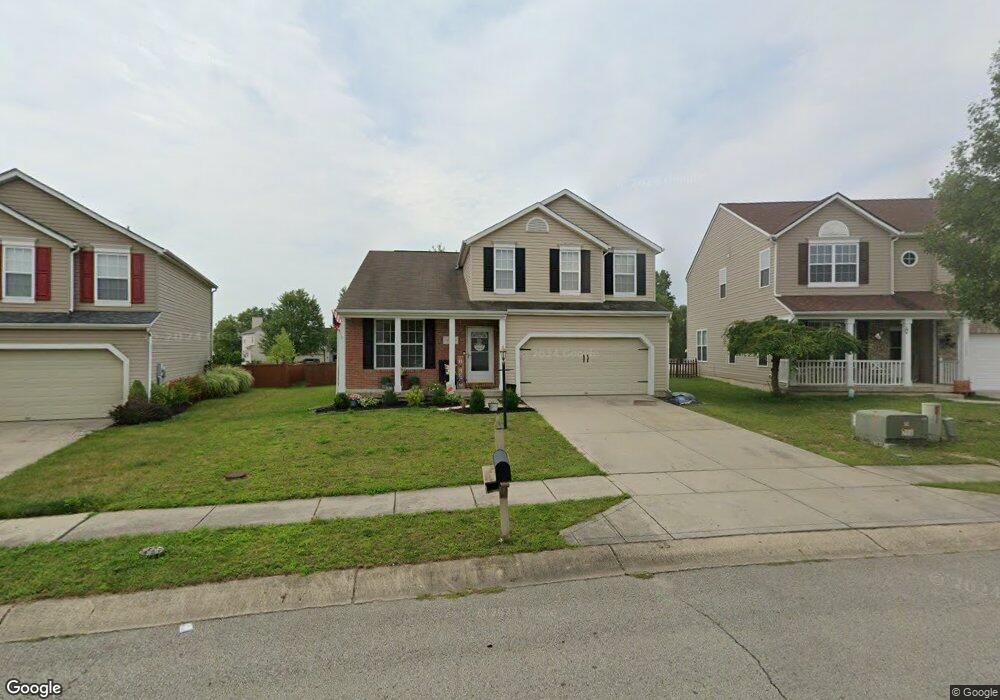
12163 Carriage Stone Dr Fishers, IN 46037
Estimated Value: $403,000 - $423,000
3
Beds
3
Baths
1,993
Sq Ft
$209/Sq Ft
Est. Value
About This Home
This home is located at 12163 Carriage Stone Dr, Fishers, IN 46037 and is currently estimated at $417,450, approximately $209 per square foot. 12163 Carriage Stone Dr is a home located in Hamilton County with nearby schools including Hickok Elementary School, Brooks School Elementary School, and Fall Creek Intermediate School.
Ownership History
Date
Name
Owned For
Owner Type
Purchase Details
Closed on
Sep 9, 2011
Sold by
Mccloud Ryan F
Bought by
Guerin Paul M and Guerin Stacy L
Current Estimated Value
Home Financials for this Owner
Home Financials are based on the most recent Mortgage that was taken out on this home.
Original Mortgage
$160,550
Outstanding Balance
$110,676
Interest Rate
4.4%
Mortgage Type
New Conventional
Estimated Equity
$306,774
Purchase Details
Closed on
Oct 6, 2005
Sold by
Bartelmey Sarah A
Bought by
Mccloud Ryan F
Home Financials for this Owner
Home Financials are based on the most recent Mortgage that was taken out on this home.
Original Mortgage
$158,436
Interest Rate
6.2%
Mortgage Type
Fannie Mae Freddie Mac
Purchase Details
Closed on
Jun 24, 2005
Sold by
M/I Homes Of Indiana Lp
Bought by
Mccloud Ryan F and Bartelmey Sarah A
Home Financials for this Owner
Home Financials are based on the most recent Mortgage that was taken out on this home.
Original Mortgage
$137,850
Interest Rate
5.69%
Mortgage Type
Fannie Mae Freddie Mac
Create a Home Valuation Report for This Property
The Home Valuation Report is an in-depth analysis detailing your home's value as well as a comparison with similar homes in the area
Home Values in the Area
Average Home Value in this Area
Purchase History
| Date | Buyer | Sale Price | Title Company |
|---|---|---|---|
| Guerin Paul M | -- | None Available | |
| Mccloud Ryan F | -- | -- | |
| Mccloud Ryan F | -- | -- |
Source: Public Records
Mortgage History
| Date | Status | Borrower | Loan Amount |
|---|---|---|---|
| Open | Guerin Paul M | $160,550 | |
| Previous Owner | Mccloud Ryan F | $158,436 | |
| Previous Owner | Mccloud Ryan F | $137,850 |
Source: Public Records
Tax History Compared to Growth
Tax History
| Year | Tax Paid | Tax Assessment Tax Assessment Total Assessment is a certain percentage of the fair market value that is determined by local assessors to be the total taxable value of land and additions on the property. | Land | Improvement |
|---|---|---|---|---|
| 2024 | $4,241 | $378,500 | $48,000 | $330,500 |
| 2023 | $4,241 | $374,200 | $48,000 | $326,200 |
| 2022 | $3,166 | $332,700 | $48,000 | $284,700 |
| 2021 | $3,166 | $266,600 | $48,000 | $218,600 |
| 2020 | $3,147 | $261,300 | $48,000 | $213,300 |
| 2019 | $2,980 | $247,800 | $38,400 | $209,400 |
| 2018 | $2,773 | $232,400 | $38,400 | $194,000 |
| 2017 | $2,443 | $212,200 | $38,400 | $173,800 |
| 2016 | $2,371 | $208,300 | $38,400 | $169,900 |
| 2014 | $1,990 | $193,100 | $38,400 | $154,700 |
| 2013 | $1,990 | $198,000 | $38,400 | $159,600 |
Source: Public Records
Map
Nearby Homes
- 12230 Cobblestone Dr
- 12307 Chiseled Stone Dr
- 12036 Weathered Edge Dr
- 12218 Weathered Edge Dr
- 12337 River Valley Dr
- 12635 Touchdown Dr
- 12641 Chiefs Ct
- 11581 Ludlow Dr
- 11579 Townsend Ct
- 12604 Brooks School Rd
- 12622 Whisper Way
- 12419 Brandamore Ln
- 11517 Moss Rock Ct
- 12864 Hanley Dr
- 11932 Hollyhock Dr
- 13091 Duval Dr
- 11318 Talon Trace
- 11502 Hearthstone Dr
- 12430 Hyacinth Dr
- 12236 Quarterback Ln
- 12153 Carriage Stone Dr
- 12173 Carriage Stone Dr
- 12116 Flintstone Ct
- 12143 Carriage Stone Dr
- 12183 Carriage Stone Dr
- 12164 Carriage Stone Dr
- 12133 Carriage Stone Dr
- 12193 Carriage Stone Dr
- 12102 Flintstone Ct
- 12134 Carriage Stone Dr
- 12102 Flint Stone Ct
- 12224 Slate Dr
- 12103 Flintstone Ct
- 12198 Carriage Stone Dr
- 12203 Carriage Stone Dr
- 12226 Carriage Stone Dr
- 12234 Slate Dr
- 12237 Carriage Stone Dr
- 12090 Flintstone Ct
- 12114 Flagstone Dr