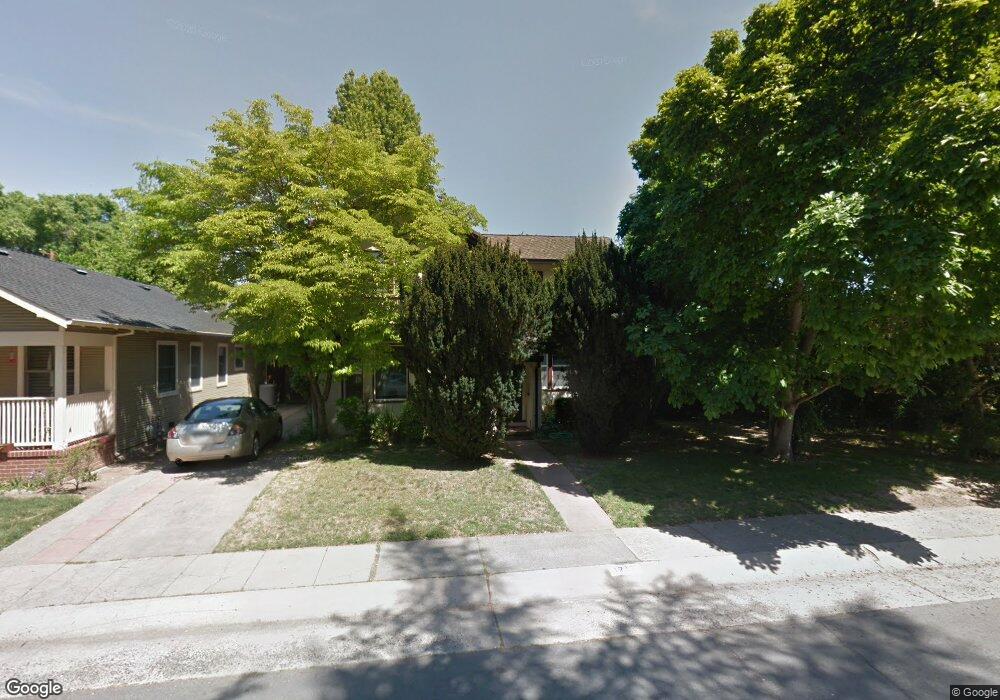
1217 8th Ave Sacramento, CA 95818
Land Park NeighborhoodEstimated Value: $645,000 - $1,512,000
4
Beds
1
Bath
2,610
Sq Ft
$389/Sq Ft
Est. Value
About This Home
This home is located at 1217 8th Ave, Sacramento, CA 95818 and is currently estimated at $1,015,951, approximately $389 per square foot. 1217 8th Ave is a home located in Sacramento County with nearby schools including Crocker/Riverside Elementary School, California Middle, and C. K. McClatchy High.
Ownership History
Date
Name
Owned For
Owner Type
Purchase Details
Closed on
Oct 22, 2018
Sold by
Nakatani Roy Akio and Nakatani Ritsuko Elaine
Bought by
Nakatani Thomas Shoichi and Nakatani Family Revocable Trus
Current Estimated Value
Purchase Details
Closed on
Sep 15, 2009
Sold by
Nakatani Roy A and Nakatani Ritsuko
Bought by
Nakatani Roy Akio and Nakatani Ritsuko Elaine
Home Financials for this Owner
Home Financials are based on the most recent Mortgage that was taken out on this home.
Original Mortgage
$391,500
Interest Rate
4.75%
Mortgage Type
New Conventional
Purchase Details
Closed on
Aug 11, 2004
Sold by
Nakatani Roy A and Nakatani Ritsuko
Bought by
Nakatani Roy A and Nakatani Ritsuko
Home Financials for this Owner
Home Financials are based on the most recent Mortgage that was taken out on this home.
Original Mortgage
$237,000
Interest Rate
5.45%
Mortgage Type
New Conventional
Create a Home Valuation Report for This Property
The Home Valuation Report is an in-depth analysis detailing your home's value as well as a comparison with similar homes in the area
Home Values in the Area
Average Home Value in this Area
Purchase History
| Date | Buyer | Sale Price | Title Company |
|---|---|---|---|
| Nakatani Thomas Shoichi | -- | None Available | |
| Nakatani Roy Akio | -- | Fidelity National Title Co | |
| Nakatani Roy A | -- | Ticor Title Company |
Source: Public Records
Mortgage History
| Date | Status | Borrower | Loan Amount |
|---|---|---|---|
| Closed | Nakatani Roy Akio | $391,500 | |
| Closed | Nakatani Roy A | $237,000 |
Source: Public Records
Tax History Compared to Growth
Tax History
| Year | Tax Paid | Tax Assessment Tax Assessment Total Assessment is a certain percentage of the fair market value that is determined by local assessors to be the total taxable value of land and additions on the property. | Land | Improvement |
|---|---|---|---|---|
| 2025 | $1,812 | $123,375 | $43,050 | $80,325 |
| 2024 | $1,812 | $120,956 | $42,206 | $78,750 |
| 2023 | $1,773 | $118,585 | $41,379 | $77,206 |
| 2022 | $1,744 | $116,261 | $40,568 | $75,693 |
| 2021 | $1,673 | $113,982 | $39,773 | $74,209 |
| 2020 | $1,679 | $112,815 | $39,366 | $73,449 |
| 2019 | $1,647 | $110,604 | $38,595 | $72,009 |
| 2018 | $1,529 | $108,437 | $37,839 | $70,598 |
| 2017 | $1,509 | $106,312 | $37,098 | $69,214 |
| 2016 | $1,415 | $104,228 | $36,371 | $67,857 |
| 2015 | $1,395 | $102,663 | $35,825 | $66,838 |
| 2014 | $1,364 | $100,661 | $35,127 | $65,534 |
Source: Public Records
Map
Nearby Homes
- 3098 Riverside Blvd
- 849 8th Ave
- 1032 10th Ave
- 710 7th Ave
- 1432 Teneighth Way
- 625 Robertson Way
- 613 Swanston Dr
- 749 3rd Ave Unit 3
- 1701 9th Ave
- 808 Fremont Way
- 1615 Vallejo Way
- 941 McClatchy Way
- 1831 9th Ave
- 1725 Vallejo Way
- 1756 Vallejo Way
- 2750 Moonflower St
- 2726 Moonflower St
- 2766 San Luis Ct
- 2780 Harkness St
- 2825 Elderberry St