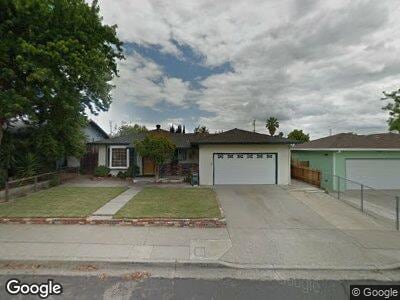
1217 Botelho St Antioch, CA 94509
Estimated Value: $503,000 - $514,000
3
Beds
2
Baths
1,169
Sq Ft
$435/Sq Ft
Est. Value
About This Home
This home is located at 1217 Botelho St, Antioch, CA 94509 and is currently estimated at $508,646, approximately $435 per square foot. 1217 Botelho St is a home located in Contra Costa County with nearby schools including Kimball Elementary School, Antioch Middle School, and Antioch High School.
Ownership History
Date
Name
Owned For
Owner Type
Purchase Details
Closed on
Oct 7, 2020
Sold by
Coggin Debby Marie and Lanier Raymond Lanzie
Bought by
Coggin Debby Marie and Lanier Raymond Lanzie
Current Estimated Value
Home Financials for this Owner
Home Financials are based on the most recent Mortgage that was taken out on this home.
Original Mortgage
$30,000
Outstanding Balance
$11,419
Interest Rate
2.9%
Mortgage Type
New Conventional
Estimated Equity
$496,860
Purchase Details
Closed on
Sep 21, 2000
Sold by
Mathers Thomas O
Bought by
Lanier Raymond Lanzie and Coggin Debby Marie
Home Financials for this Owner
Home Financials are based on the most recent Mortgage that was taken out on this home.
Original Mortgage
$52,000
Interest Rate
7.96%
Mortgage Type
Purchase Money Mortgage
Purchase Details
Closed on
Mar 25, 1994
Sold by
Coggin David W and Coggin Donna C
Bought by
Coggin David W and Coggin Donna C
Create a Home Valuation Report for This Property
The Home Valuation Report is an in-depth analysis detailing your home's value as well as a comparison with similar homes in the area
Home Values in the Area
Average Home Value in this Area
Purchase History
| Date | Buyer | Sale Price | Title Company |
|---|---|---|---|
| Coggin Debby Marie | -- | Chicago Title Company | |
| Lanier Raymond Lanzie | -- | Placer Title Company | |
| Coggin David W | -- | -- |
Source: Public Records
Mortgage History
| Date | Status | Borrower | Loan Amount |
|---|---|---|---|
| Open | Coggin Debby Marie | $30,000 | |
| Closed | Lanier Raymond Lenzie | $25,000 | |
| Open | Lanier Raymond Lanzie | $200,000 | |
| Closed | Lanier Raymond Lenzie | $120,000 | |
| Closed | Lanier Raymond Lanzie | $52,000 |
Source: Public Records
Tax History Compared to Growth
Tax History
| Year | Tax Paid | Tax Assessment Tax Assessment Total Assessment is a certain percentage of the fair market value that is determined by local assessors to be the total taxable value of land and additions on the property. | Land | Improvement |
|---|---|---|---|---|
| 2024 | $1,332 | $82,135 | $26,406 | $55,729 |
| 2023 | $1,332 | $80,526 | $25,889 | $54,637 |
| 2022 | $1,316 | $78,948 | $25,382 | $53,566 |
| 2021 | $1,263 | $77,401 | $24,885 | $52,516 |
| 2019 | $1,219 | $75,107 | $24,148 | $50,959 |
| 2018 | $1,174 | $73,635 | $23,675 | $49,960 |
| 2017 | $1,136 | $72,192 | $23,211 | $48,981 |
| 2016 | $1,090 | $70,777 | $22,756 | $48,021 |
| 2015 | $1,066 | $69,715 | $22,415 | $47,300 |
| 2014 | $1,027 | $68,350 | $21,976 | $46,374 |
Source: Public Records
Map
Nearby Homes
- 117 S Lake Dr
- 1532 Marshall St
- 89 W Lake Dr
- 1816 Parsons Ln
- 320 E 13th St
- 313 Grangnelli Ave
- 310 Nash Ave
- 1901 Woodland Dr
- 1944 Calaveras Cir
- 1908 Grizzly Ct
- 2246 Renwick Ln
- 1311 August Way
- 1323 August Way
- 2270 Renwick Ln
- 1834 Paris Ln
- 2299 Renwick Ln
- 2008 Cavallo Rd
- 1925 Crestwood Dr
- 1929 Crestwood Dr
- 1925 Alpha Way
- 1217 Botelho St
- 1221 Botelho St
- 1213 Botelho St
- 1218 Simmons St
- 1222 Simmons St
- 1214 Simmons St
- 1225 Botelho St
- 1209 Botelho St
- 1216 Botelho St
- 1220 Botelho St
- 1226 Simmons St
- 1212 Botelho St
- 1210 Simmons St
- 1229 Botelho St
- 1205 Botelho St
- 1224 Botelho St
- 1208 Botelho St
- 1206 Simmons St
- 1204 Botelho St
- 1228 Botelho St