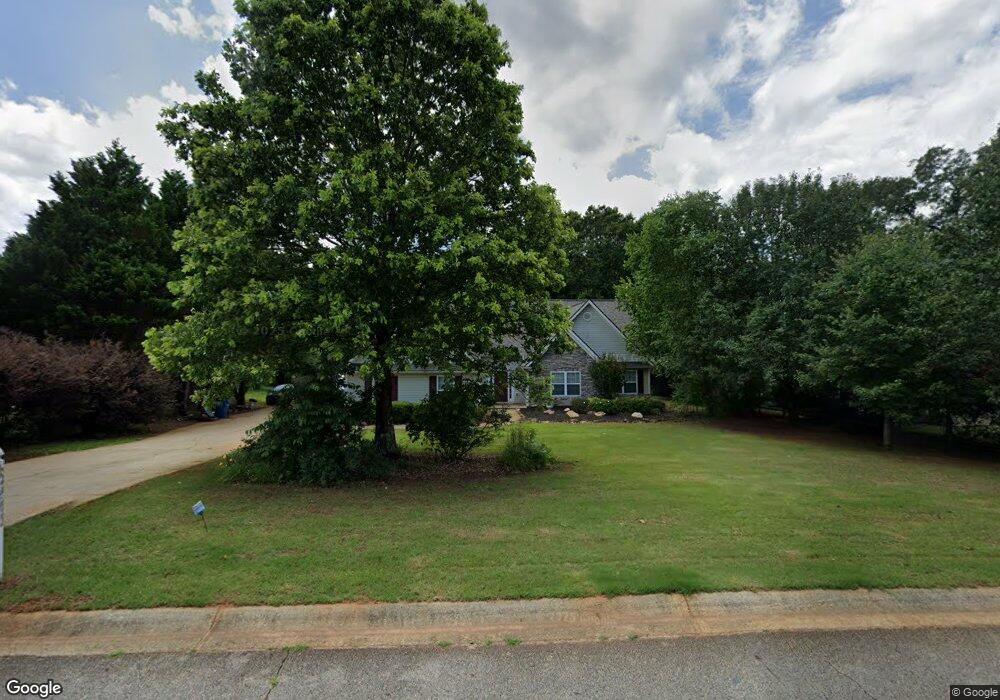
1217 Bridge Crest Dr Winder, GA 30680
Estimated Value: $377,586 - $417,000
3
Beds
3
Baths
2,578
Sq Ft
$154/Sq Ft
Est. Value
About This Home
This home is located at 1217 Bridge Crest Dr, Winder, GA 30680 and is currently estimated at $397,397, approximately $154 per square foot. 1217 Bridge Crest Dr is a home located in Barrow County with nearby schools including Statham Elementary School, Bear Creek Middle School, and Winder-Barrow High School.
Ownership History
Date
Name
Owned For
Owner Type
Purchase Details
Closed on
May 14, 2015
Sold by
Haun Matthew Ryn
Bought by
Sheats Tracy Elaine
Current Estimated Value
Home Financials for this Owner
Home Financials are based on the most recent Mortgage that was taken out on this home.
Original Mortgage
$146,301
Outstanding Balance
$112,991
Interest Rate
3.75%
Mortgage Type
FHA
Estimated Equity
$284,406
Purchase Details
Closed on
Aug 24, 2005
Sold by
Haun Matthew Ryan And
Bought by
Haun Matthew Ryan And
Purchase Details
Closed on
Jul 20, 2004
Sold by
R-3 Ents Inc
Bought by
Bradley Matthew R and Bradley Angela
Home Financials for this Owner
Home Financials are based on the most recent Mortgage that was taken out on this home.
Original Mortgage
$111,600
Interest Rate
3.75%
Mortgage Type
New Conventional
Purchase Details
Closed on
Apr 29, 2003
Sold by
Gwd Inc
Bought by
R-3 Enterprises Inc
Purchase Details
Closed on
Aug 16, 2002
Bought by
Gwd Inc
Create a Home Valuation Report for This Property
The Home Valuation Report is an in-depth analysis detailing your home's value as well as a comparison with similar homes in the area
Home Values in the Area
Average Home Value in this Area
Purchase History
| Date | Buyer | Sale Price | Title Company |
|---|---|---|---|
| Sheats Tracy Elaine | $149,000 | -- | |
| Haun Matthew Ryan And | -- | -- | |
| Bradley Matthew R | $139,500 | -- | |
| R-3 Enterprises Inc | $450,000 | -- | |
| Gwd Inc | -- | -- |
Source: Public Records
Mortgage History
| Date | Status | Borrower | Loan Amount |
|---|---|---|---|
| Open | Sheats Tracy Elaine | $146,301 | |
| Previous Owner | Bradley Matthew R | $111,600 |
Source: Public Records
Tax History Compared to Growth
Tax History
| Year | Tax Paid | Tax Assessment Tax Assessment Total Assessment is a certain percentage of the fair market value that is determined by local assessors to be the total taxable value of land and additions on the property. | Land | Improvement |
|---|---|---|---|---|
| 2024 | $3,311 | $135,285 | $28,000 | $107,285 |
| 2023 | $2,913 | $136,285 | $28,000 | $108,285 |
| 2022 | $3,224 | $114,451 | $28,000 | $86,451 |
| 2021 | $3,051 | $102,451 | $16,000 | $86,451 |
| 2020 | $2,570 | $86,226 | $16,000 | $70,226 |
| 2019 | $2,614 | $86,226 | $16,000 | $70,226 |
| 2018 | $2,421 | $80,772 | $13,600 | $67,172 |
| 2017 | $1,709 | $58,700 | $13,600 | $45,100 |
| 2016 | $1,663 | $56,950 | $13,600 | $43,350 |
| 2015 | $1,685 | $57,425 | $13,600 | $43,825 |
| 2014 | $1,522 | $51,356 | $7,056 | $44,300 |
| 2013 | -- | $48,546 | $7,056 | $41,490 |
Source: Public Records
Map
Nearby Homes
- 1453 Solomon Dr
- 1023 Solomon Ct
- 1431 Solomon Dr
- 385 Finch Landing Rd
- 1295 Double Bridges Rd
- 212 Rainbow Ln
- 1415 Red Oak Way
- 1642 White Oak Dr
- 113 Platte St
- 207 Cedar Grove Church Rd
- 330 Anchors Way
- 670 Cedar Grove Church Rd
- 670 Cedar Grove Church Rd
- 1914 Hearthstone Ct
- 1212 Highway 211 NE
- 1226 Highway 211 NE
- 315 Paige Way
- 1593 Highway 82
- 1724 Cedar Grove Church Rd
- 51 Brockton Way Unit 2
- 1219 Bridge Crest Dr
- 0 Bridge Crest Dr Unit 8892473
- 1144 Bridge Crest Dr
- 1213 Bridge Crest Dr Unit 7
- 1213 Bridge Crest Dr
- 1213 Bridge Crest Dr
- 1221 Bridge Crest Dr
- 1218 Bridge Crest Dr
- 1216 Bridge Crest Dr
- 1223 Bridge Crest Dr
- 1225 Bridge Crest Dr
- 1211 Bridge Crest Dr
- 1214 Bridge Crest Dr
- 1222 Bridge Crest Dr
- 1212 Bridge Crest Dr
- 1224 Bridge Crest Dr
- 1141 Bridge Crest Ct
- 1143 Bridge Crest Ct
- 1143 Bridge Crest Ct Unit 1
- 1209 Bridge Crest Dr Unit 5