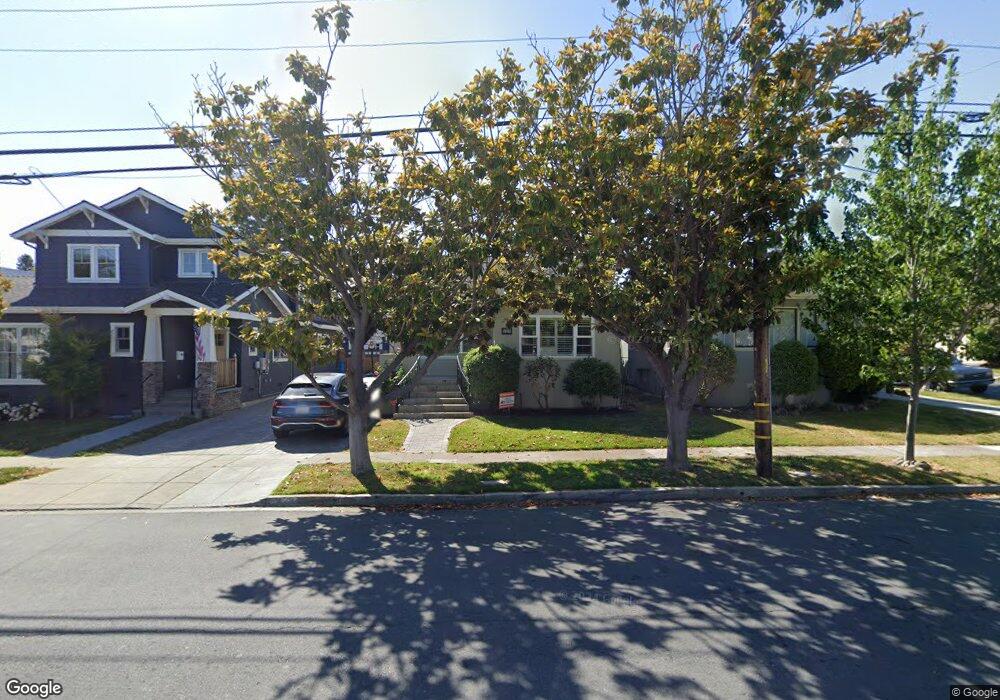
1217 Grove Ave Burlingame, CA 94010
Burlingame Grove NeighborhoodEstimated Value: $2,154,000 - $3,031,000
4
Beds
2
Baths
1,910
Sq Ft
$1,347/Sq Ft
Est. Value
About This Home
This home is located at 1217 Grove Ave, Burlingame, CA 94010 and is currently estimated at $2,573,491, approximately $1,347 per square foot. 1217 Grove Ave is a home located in San Mateo County with nearby schools including Lincoln Elementary School, Burlingame Intermediate School, and Burlingame High School.
Ownership History
Date
Name
Owned For
Owner Type
Purchase Details
Closed on
Aug 18, 2020
Sold by
Mutto Kevin Francis and 2017 Kevin Francis
Bought by
Slane Mary Kathleen and Mutto Kevin Francis
Current Estimated Value
Purchase Details
Closed on
Apr 7, 2020
Sold by
Mutto Kevin F
Bought by
Mutto Kevin Francis and 2017 Kevin Francis
Home Financials for this Owner
Home Financials are based on the most recent Mortgage that was taken out on this home.
Original Mortgage
$765,500
Interest Rate
3.4%
Mortgage Type
New Conventional
Purchase Details
Closed on
Feb 26, 2018
Sold by
Mutto Kevin F
Bought by
Mutto Kevin Francis and 2017 Kevin Francis Mutto Revoc
Home Financials for this Owner
Home Financials are based on the most recent Mortgage that was taken out on this home.
Original Mortgage
$846,000
Interest Rate
4.04%
Mortgage Type
New Conventional
Purchase Details
Closed on
Nov 17, 2017
Sold by
Mutto Kevin Francis
Bought by
Mutto Kevin Francis and 2017 Kevin Francis Mutto Revoc
Purchase Details
Closed on
Nov 15, 2017
Sold by
Cini Patricia and Mutto Patricia
Bought by
Francis Kevin
Create a Home Valuation Report for This Property
The Home Valuation Report is an in-depth analysis detailing your home's value as well as a comparison with similar homes in the area
Home Values in the Area
Average Home Value in this Area
Purchase History
| Date | Buyer | Sale Price | Title Company |
|---|---|---|---|
| Slane Mary Kathleen | -- | None Available | |
| Mutto Kevin Francis | -- | Chicago Title Company | |
| Mutto Kevin F | -- | Chicago Title Company | |
| Mutto Kevin F | -- | Chicago Title Company | |
| Mutto Kevin Francis | -- | Chicago Title Co | |
| Mutto Kevin F | -- | Chicago Title Co | |
| Mutto Kevin Francis | -- | None Available | |
| Francis Kevin | -- | None Available |
Source: Public Records
Mortgage History
| Date | Status | Borrower | Loan Amount |
|---|---|---|---|
| Closed | Mutto Kevin F | $765,500 | |
| Closed | Mutto Kevin F | $846,000 |
Source: Public Records
Tax History Compared to Growth
Tax History
| Year | Tax Paid | Tax Assessment Tax Assessment Total Assessment is a certain percentage of the fair market value that is determined by local assessors to be the total taxable value of land and additions on the property. | Land | Improvement |
|---|---|---|---|---|
| 2025 | $3,770 | $310,737 | $186,447 | $124,290 |
| 2023 | $3,770 | $298,672 | $179,208 | $119,464 |
| 2022 | $3,641 | $292,817 | $175,695 | $117,122 |
| 2021 | $3,642 | $287,076 | $172,250 | $114,826 |
| 2020 | $3,568 | $284,133 | $170,484 | $113,649 |
| 2019 | $3,495 | $278,563 | $167,142 | $111,421 |
| 2018 | $3,432 | $273,102 | $163,865 | $109,237 |
| 2017 | $3,405 | $267,748 | $160,652 | $107,096 |
| 2016 | $3,279 | $262,499 | $157,502 | $104,997 |
| 2015 | $3,262 | $258,557 | $155,137 | $103,420 |
| 2014 | $3,217 | $253,494 | $152,099 | $101,395 |
Source: Public Records
Map
Nearby Homes
- 1325 Paloma Ave
- 1300 Paloma Ave
- 1431 Laguna Ave
- 1237 Capuchino Ave Unit 7
- 1217 Paloma Ave Unit 3
- 1421 El Camino Real Unit 6
- 1500 Broadway Unit 205
- 1137 Paloma Ave Unit E
- 1111 Laguna Ave
- 1115 Capuchino Ave
- 1315 Carmelita Ave
- 1044 Paloma Ave
- 2301 Easton Dr
- 1735 Crockett Ln
- 8 Reynolds Ct
- 824 El Camino Real
- 900 Toyon Dr
- 1568 Columbus Ave
- 1425 Castillo Ave
- 1030 Morrell Ave
- 1213 Grove Ave
- 1366 Paloma Ave
- 1209 Grove Ave
- 1348 Paloma Ave
- 1205 Grove Ave
- 1355 Paloma Ave
- 1344 Paloma Ave
- 1349 Laguna Ave
- 1355 Laguna Ave
- 1305 Grove Ave
- 1345 Laguna Ave
- 1340 Paloma Ave
- 1216 Grove Ave
- 1349 Paloma Ave
- 1220 Grove Ave
- 1212 Grove Ave
- 1208 Grove Ave
- 1309 Grove Ave
- 1345 Paloma Ave
- 1341 Laguna Ave