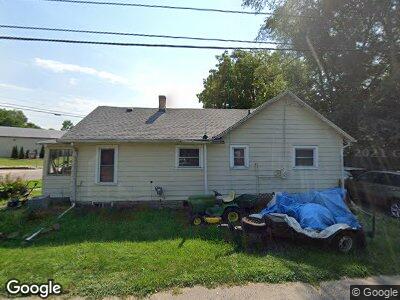
1217 Marquette St Lansing, MI 48906
Northwestside NeighborhoodEstimated Value: $103,000 - $128,073
2
Beds
1
Bath
843
Sq Ft
$138/Sq Ft
Est. Value
About This Home
This home is located at 1217 Marquette St, Lansing, MI 48906 and is currently estimated at $116,518, approximately $138 per square foot. 1217 Marquette St is a home located in Ingham County with nearby schools including Cumberland Elementary School, Pattengill Academy, and J.W. Sexton High School.
Ownership History
Date
Name
Owned For
Owner Type
Purchase Details
Closed on
Apr 27, 2015
Sold by
Vermetti Jason and Rase Cindy
Bought by
Hobbs Willie and Porter Nathaniel
Current Estimated Value
Purchase Details
Closed on
Jul 7, 2009
Sold by
Vermetti Jason
Bought by
Rase Cindy and Vermetti Jason
Home Financials for this Owner
Home Financials are based on the most recent Mortgage that was taken out on this home.
Original Mortgage
$23,000
Interest Rate
8%
Mortgage Type
Seller Take Back
Purchase Details
Closed on
Jun 29, 2009
Sold by
Vermetti Jason and Rase Cindy
Bought by
Hobbs Willie and Porter Nathaniel
Home Financials for this Owner
Home Financials are based on the most recent Mortgage that was taken out on this home.
Original Mortgage
$23,000
Interest Rate
8%
Mortgage Type
Seller Take Back
Purchase Details
Closed on
Nov 6, 2008
Sold by
Jackson Deborah L
Bought by
Us Bank National Association
Create a Home Valuation Report for This Property
The Home Valuation Report is an in-depth analysis detailing your home's value as well as a comparison with similar homes in the area
Home Values in the Area
Average Home Value in this Area
Purchase History
| Date | Buyer | Sale Price | Title Company |
|---|---|---|---|
| Hobbs Willie | -- | None Available | |
| Rase Cindy | -- | None Available | |
| Hobbs Willie | $25,000 | None Available | |
| Us Bank National Association | $17,000 | None Available |
Source: Public Records
Mortgage History
| Date | Status | Borrower | Loan Amount |
|---|---|---|---|
| Open | Hobbs Willie | $20,000 | |
| Previous Owner | Hobbs Willie | $23,000 | |
| Previous Owner | Jackson Deborah L | $48,000 | |
| Previous Owner | Jackson Deborah L | $4,060 |
Source: Public Records
Tax History Compared to Growth
Tax History
| Year | Tax Paid | Tax Assessment Tax Assessment Total Assessment is a certain percentage of the fair market value that is determined by local assessors to be the total taxable value of land and additions on the property. | Land | Improvement |
|---|---|---|---|---|
| 2024 | $14 | $41,900 | $9,900 | $32,000 |
| 2023 | $5,585 | $38,600 | $9,900 | $28,700 |
| 2022 | $1,909 | $35,200 | $9,900 | $25,300 |
| 2021 | $1,865 | $30,800 | $7,200 | $23,600 |
| 2020 | $1,852 | $28,000 | $7,200 | $20,800 |
| 2019 | $3,208 | $25,600 | $7,200 | $18,400 |
| 2018 | $1,696 | $22,100 | $7,200 | $14,900 |
| 2017 | $1,632 | $22,100 | $7,200 | $14,900 |
| 2016 | $2,236 | $21,800 | $7,200 | $14,600 |
| 2015 | $2,236 | $20,800 | $14,447 | $6,353 |
| 2014 | $2,236 | $21,400 | $18,387 | $3,013 |
Source: Public Records
Map
Nearby Homes
- 1515 Biltmore Blvd
- 1724 Biltmore Blvd
- 3104 Westwood Ave
- 5250 N Grand River Ave
- 2122 Coolidge St
- 425 Filley St
- 411 Filley St
- 2255 Pembroke Rd
- 1505 Bassett Ave
- 429 W Sheridan Rd
- 1522 Robertson Ave
- 1900 Kaplan St
- 2529 Arlington Rd
- 3425 Turner Rd
- 1505 N Martin Luther King jr Blvd
- 1442 Robertson Ave
- 2526 Lafayette Ave
- 1432 Redwood St
- 218 W Thomas St
- 4005 N Grand River Ave
- 1217 Marquette St
- 2840 Hollywood St
- 1301 Downey St
- 1307 Downey St
- 2841 Hollywood St
- 2826 Hollywood St
- 2833 Hollywood St
- 1315 Downey St
- 2839 N Martin Luther King jr Blvd
- 2839 N Mlk Blvd
- 2822 Hollywood St
- 2827 Hollywood St
- 2835 N Martin Luther King
- 2835 N Mlk Blvd
- 1300 Marquette St
- 1319 Downey St
- 2829 N Mlk Blvd
- 2823 Hollywood St
- 2816 Hollywood St