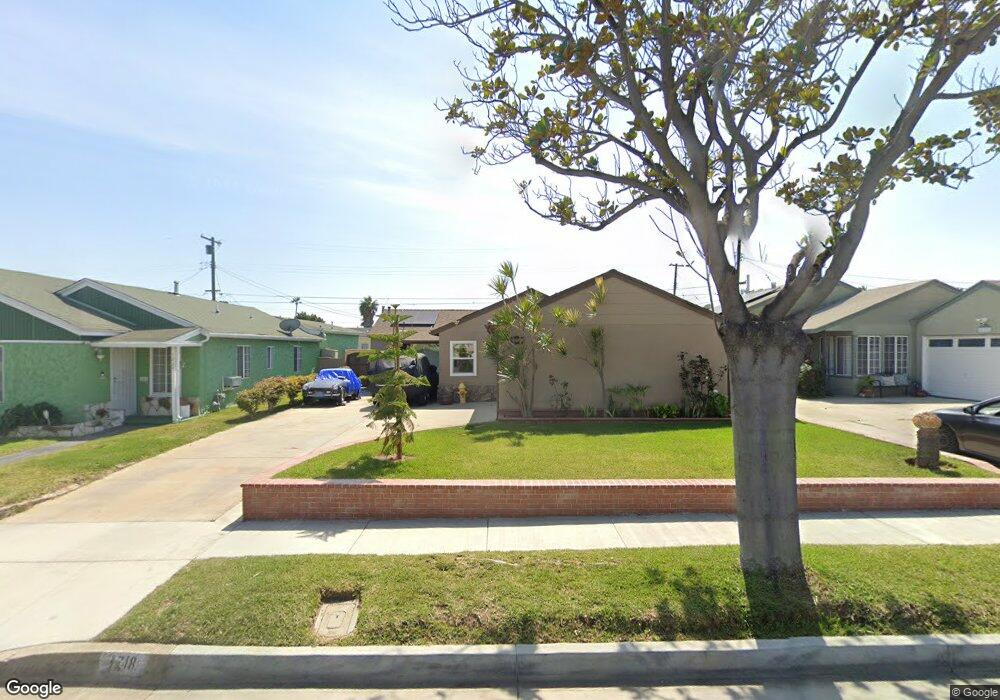
1218 E 139th St Compton, CA 90222
Estimated Value: $590,000 - $674,000
3
Beds
1
Bath
1,333
Sq Ft
$478/Sq Ft
Est. Value
About This Home
This home is located at 1218 E 139th St, Compton, CA 90222 and is currently estimated at $637,662, approximately $478 per square foot. 1218 E 139th St is a home located in Los Angeles County with nearby schools including Ronald E. McNair Elementary School, Enterprise Middle School, and Centennial High School.
Ownership History
Date
Name
Owned For
Owner Type
Purchase Details
Closed on
May 21, 2018
Sold by
Velasquez Mario
Bought by
Velasquez Mario and Mario Velasquez Trust
Current Estimated Value
Purchase Details
Closed on
Nov 1, 2010
Sold by
Federal National Mortgage Association
Bought by
Velasquez Mario
Home Financials for this Owner
Home Financials are based on the most recent Mortgage that was taken out on this home.
Original Mortgage
$175,437
Outstanding Balance
$115,159
Interest Rate
4.17%
Mortgage Type
FHA
Estimated Equity
$522,503
Purchase Details
Closed on
Feb 10, 2010
Sold by
Benton Billie E and Benton Myrtle
Bought by
Federal National Mortgage Association
Purchase Details
Closed on
Jul 21, 1995
Sold by
Benton Billie E and Benton Myrtle
Bought by
Benton Billie E
Create a Home Valuation Report for This Property
The Home Valuation Report is an in-depth analysis detailing your home's value as well as a comparison with similar homes in the area
Home Values in the Area
Average Home Value in this Area
Purchase History
| Date | Buyer | Sale Price | Title Company |
|---|---|---|---|
| Velasquez Mario | -- | None Available | |
| Velasquez Mario | $180,000 | Lsi Title Company Ca | |
| Federal National Mortgage Association | $228,789 | Accommodation | |
| Benton Billie E | -- | -- |
Source: Public Records
Mortgage History
| Date | Status | Borrower | Loan Amount |
|---|---|---|---|
| Open | Velasquez Mario | $175,437 |
Source: Public Records
Tax History
| Year | Tax Paid | Tax Assessment Tax Assessment Total Assessment is a certain percentage of the fair market value that is determined by local assessors to be the total taxable value of land and additions on the property. | Land | Improvement |
|---|---|---|---|---|
| 2025 | $3,427 | $230,596 | $136,053 | $94,543 |
| 2024 | $3,427 | $226,076 | $133,386 | $92,690 |
| 2023 | $3,386 | $221,644 | $130,771 | $90,873 |
| 2022 | $3,168 | $217,299 | $128,207 | $89,092 |
| 2021 | $3,217 | $213,040 | $125,694 | $87,346 |
| 2020 | $3,156 | $210,857 | $124,406 | $86,451 |
| 2019 | $3,129 | $206,723 | $121,967 | $84,756 |
| 2018 | $3,025 | $202,671 | $119,576 | $83,095 |
| 2016 | $2,864 | $194,803 | $114,934 | $79,869 |
| 2015 | $2,722 | $191,878 | $113,208 | $78,670 |
| 2014 | $2,678 | $188,120 | $110,991 | $77,129 |
Source: Public Records
Map
Nearby Homes
- 1918 W Piru St
- 14118 S Zamora Ave
- 1619 W 136th St
- 14016 S Albertson Ave
- 14003 S Nestor Ave
- 1805 N Central Ave
- 1410 W Stockwell St
- 1406 W Stockwell St
- 9607 S Evers Ave
- 1418 W 134th St
- 14502 S Keene Ave
- 2015 N Belhaven Ave
- 1201 W 138th St
- 1209 W 136th St
- 14513 S Loness Ave
- 2109 N Bahama Ave
- 14605 S Bahama Ave
- 800 N Kalsman Ave
- 2215 W 132nd St
- 14433 S Cahita Ave
- 1224 E 139th St
- 1212 E 139th St
- 1225 E 140th St
- 1228 E 139th St
- 1208 E 139th St
- 1221 E 140th St
- 1229 E 140th St
- 13914 S Central Ave
- 1234 E 139th St
- 1202 E 139th St
- 1217 E 139th St
- 1223 E 139th St
- 1213 E 139th St
- 13920 S Central Ave
- 1233 E 140th St
- 1227 E 139th St
- 1209 E 139th St
- 1220 E 140th St
- 1238 E 139th St
- 13926 S Central Ave
Your Personal Tour Guide
Ask me questions while you tour the home.