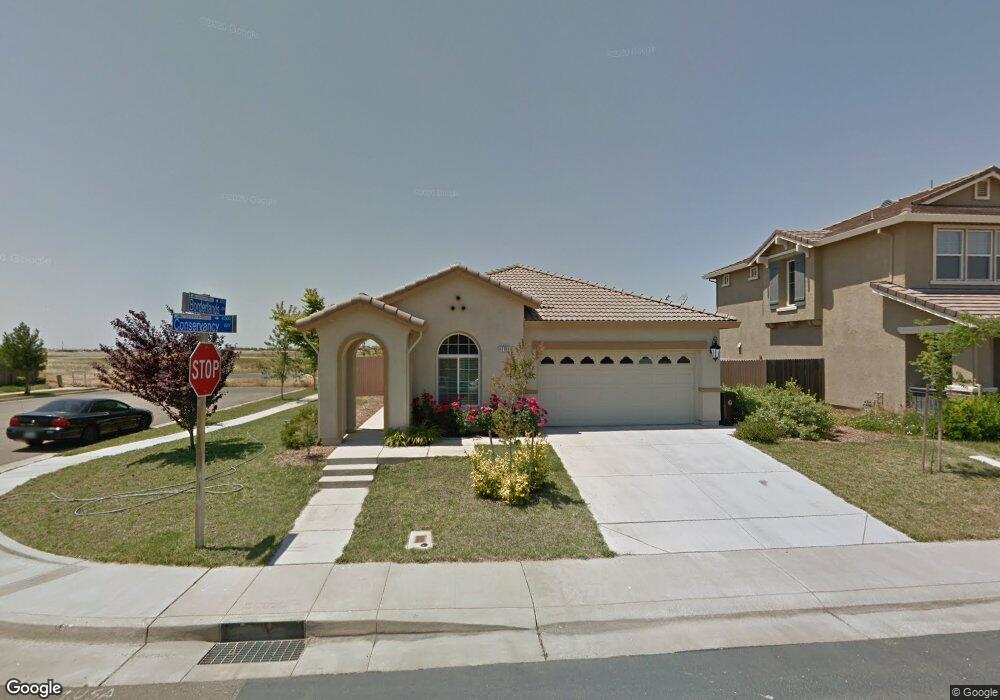
12189 Conservancy Way Unit L118 Rancho Cordova, CA 95742
Sunridge Park NeighborhoodEstimated Value: $516,000 - $567,460
3
Beds
2
Baths
1,543
Sq Ft
$350/Sq Ft
Est. Value
About This Home
This home is located at 12189 Conservancy Way Unit L118, Rancho Cordova, CA 95742 and is currently estimated at $539,365, approximately $349 per square foot. 12189 Conservancy Way Unit L118 is a home located in Sacramento County with nearby schools including Sunrise Elementary School, Katherine L. Albiani Middle School, and Pleasant Grove High School.
Ownership History
Date
Name
Owned For
Owner Type
Purchase Details
Closed on
Jul 20, 2016
Sold by
Rasim Behchet Y and Rasim Emine U
Bought by
Herrera Nicolas
Current Estimated Value
Home Financials for this Owner
Home Financials are based on the most recent Mortgage that was taken out on this home.
Original Mortgage
$344,642
Outstanding Balance
$282,164
Interest Rate
4.4%
Mortgage Type
FHA
Estimated Equity
$257,201
Purchase Details
Closed on
May 22, 2008
Sold by
Woodside Bella Brisas Inc
Bought by
Rasim Behchet Y and Rasim Emine U
Home Financials for this Owner
Home Financials are based on the most recent Mortgage that was taken out on this home.
Original Mortgage
$220,040
Interest Rate
5.87%
Mortgage Type
Purchase Money Mortgage
Purchase Details
Closed on
Feb 13, 2008
Sold by
Pleasant Valley Investments Lc
Bought by
Woodside Bella Brisas Inc
Create a Home Valuation Report for This Property
The Home Valuation Report is an in-depth analysis detailing your home's value as well as a comparison with similar homes in the area
Home Values in the Area
Average Home Value in this Area
Purchase History
| Date | Buyer | Sale Price | Title Company |
|---|---|---|---|
| Herrera Nicolas | $351,000 | Chicago Title Company | |
| Rasim Behchet Y | $275,500 | Placer Title Company | |
| Woodside Bella Brisas Inc | -- | None Available |
Source: Public Records
Mortgage History
| Date | Status | Borrower | Loan Amount |
|---|---|---|---|
| Open | Herrera Nicolas | $344,642 | |
| Previous Owner | Rasim Behchet Y | $220,040 |
Source: Public Records
Tax History Compared to Growth
Tax History
| Year | Tax Paid | Tax Assessment Tax Assessment Total Assessment is a certain percentage of the fair market value that is determined by local assessors to be the total taxable value of land and additions on the property. | Land | Improvement |
|---|---|---|---|---|
| 2025 | $9,293 | $407,359 | $121,858 | $285,501 |
| 2024 | $9,293 | $399,372 | $119,469 | $279,903 |
| 2023 | $8,321 | $391,542 | $117,127 | $274,415 |
| 2022 | $8,220 | $383,866 | $114,831 | $269,035 |
| 2021 | $8,519 | $376,340 | $112,580 | $263,760 |
| 2020 | $7,400 | $372,482 | $111,426 | $261,056 |
| 2019 | $6,633 | $365,180 | $109,242 | $255,938 |
| 2018 | $6,665 | $358,020 | $107,100 | $250,920 |
| 2017 | $6,531 | $351,000 | $105,000 | $246,000 |
| 2016 | $5,607 | $286,005 | $83,709 | $202,296 |
| 2015 | $5,373 | $269,817 | $78,971 | $190,846 |
| 2014 | $5,194 | $256,968 | $75,210 | $181,758 |
Source: Public Records
Map
Nearby Homes
- 12205 Hetch Hechy Dr
- 4074 Timberland Dr
- 12137 Wistar Way
- 4155 Aura Way
- 4159 Aura Way
- 4131 Aura Way
- 4156 Aura Way
- 12219 Alamosa Dr
- 12217 Alamosa Dr
- 4292 Aura Way
- 4284 Aura Way
- 12304 Pawcatuck Way
- 4156 Colmas Way
- 12264 Rocky Ford Way
- 12084 Prades Way
- 4160 Colmas Way
- 4159 Colmas Way
- 3983 Lucent Ct
- Gunnison Plan at Montrose at The Ranch
- Boone Plan at Montrose at The Ranch
- 12189 Conservancy Way
- 12193 Conservancy Way Unit L119
- 12193 Conservancy Way
- 4098 Arjuna Way
- 4259 Choteau Cir Unit 1
- 4259 Choteau Cir
- 12197 Conservancy Way Unit L120
- 12197 Conservancy Way
- 4094 Arjuna Way
- 4292 Borderlands Dr
- 4090 Arjuna Way
- 4106 Arjuna Way
- 4255 Choteau Cir
- 12201 Conservancy Way
- 12212 Conservancy Way
- 4086 Arjuna Way
- 4295 Borderlands Dr Unit lot43
- 4288 Borderlands Dr Unit 116
- 4288 Borderlands Dr
- 4110 Arjuna Way